

arnaud
-
Posts
281 -
Joined
-
Last visited
-
Days Won
1
Content Type
Profiles
Forums
Events
Posts posted by arnaud
-
-
@Marv: I wouldn't mind using your raw data for my model... It's with anechoic plate, isn't it?
@Ed: Here's a reason why I shouldn't have posted my simulation result in this thread. I will create a new thread and post there (did the same on HF http://www.head-fi.org/t/572968/modeling-headphone-s-acoustic-performance#post_7774290 , it'd be better to have it all in 1 place though).
There are no assumptions in the processing of test data. Only thing is that my CSDs and FRF comparisons are for a single position and not equalized (yet... Expect some update today on this). For the data acquisition, there is maybe something going on with artificial smoothing to get the signal to die within 3ms but this still needs to be investigated (difficult to compare directly the results with those of Marv due to entirely different recording process).
-
Seems like pretty much everyone with the SR009 has either a BHSE or WES!
I must be the exception to the rule then. Kind of itching though with the strength of the yen atm...
-
You, sir, are insane .... insanely cool! Great stuff!
Thank you, insanely tired too, those 4 hour nights are starting to be felt
 .
.Hi Arnaud,
I don't really know what to say. The power of modern software - astonishing!
This is an edge clamped uniformly tensioned membrane,isn't it? In the last animation what are we looking at,displacement/velocity?
I am rather confused by the large modal variation (what are we going to call the peaks and hollows?) at the edge of the diaphragm, intuitively the least likely spot for such variations. Quite frankly, at 3.7khz I would have expected a much lower mode (annular too),much more heavily damped - there goes my insight, fluttering away like that diaphragm.

Still in all, very impressive,
Bob
BTW
If you find some data on the compliance of real Mylar, remember that the bias voltage creates a negative compliance thus reducing the net compliance of the membrane.
Hi Bob, the diaphragm is modeled as a circular membrane and edges are assumed pinned. In regards to the animation, actually I should have mentionned: it is NOT to scale! It is just an animation of one of the "coupled" modes around 3.7kHz. Velocity range is actually visible for the 2 peaks where I show the contour plot. But again, properties I used for the membrane are bogus so really the diaphragm velocity isn't too trustable... BTW, I assumed 10% damping for the diaphragm and not actually modeling the perforated stators.
I think that using the straight up sweep based frequency response curves for comparison between the HD800 and 009 is probably a lot more accurate considering the delta omega problems that such a short time history give you as far as accuracy goes.
Also the numerical solution you put up was very very cool but I wonder what boundary conditions were used to prevent acoustic reflection on such a small computational domain. Again though it's very cool you have access to that kind of software to waste time on this stuff

Also the numerical solution you put up was very very cool but I wonder what boundary conditions were used to prevent acoustic reflection on such a small computational domain. Again though it's very cool you have access to that kind of software to waste time on this stuff
Good question dreadhead... The acoustic boundary condition is simply rho *c (acoustic impedance in free field). But I was indeed concerned about how large the box should be around the headphone to get reasonable results when I did the same kind of simulation for the HD800. I have been looking at another type of simulation (using boundary element method referred above) where the headphone would actually be modeled along with the whole radiation space but not quite satisfied yet with the HD800 results. I may try it with the SR009 geometry...
-
Arnaud how did you generate those comparison plots for frequency response? I am using Tyll's data and getting something that looks different. I checked it 3 times.
Using the 'Headphone Data' sheet, column AH for the time vector, columns AK and AL for the impulse responses of Left/Right ears respectively. Let me know, I could certainly have goofed of somewhere.
-
Edit: 9/24, different mic positions and cleaner pics / animations
Here is an initial attempt at understanding what makes the SR-009 measure how it does. It's all very very fresh and largely guessed properties so I could be totally off the map with these predictions, but at least I have some pretty pictures and animations to share
 .
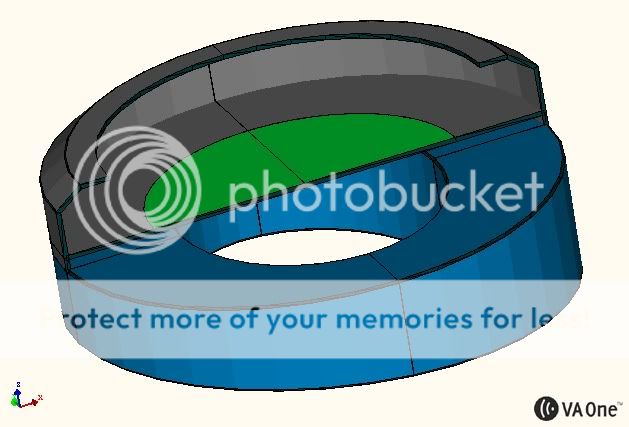
.Here's the simplified geometry of the model (note that the earpads are currently modeled as rigid surfaces. Since there's a thick leather cover, it shouldn't that far off (little absorption):
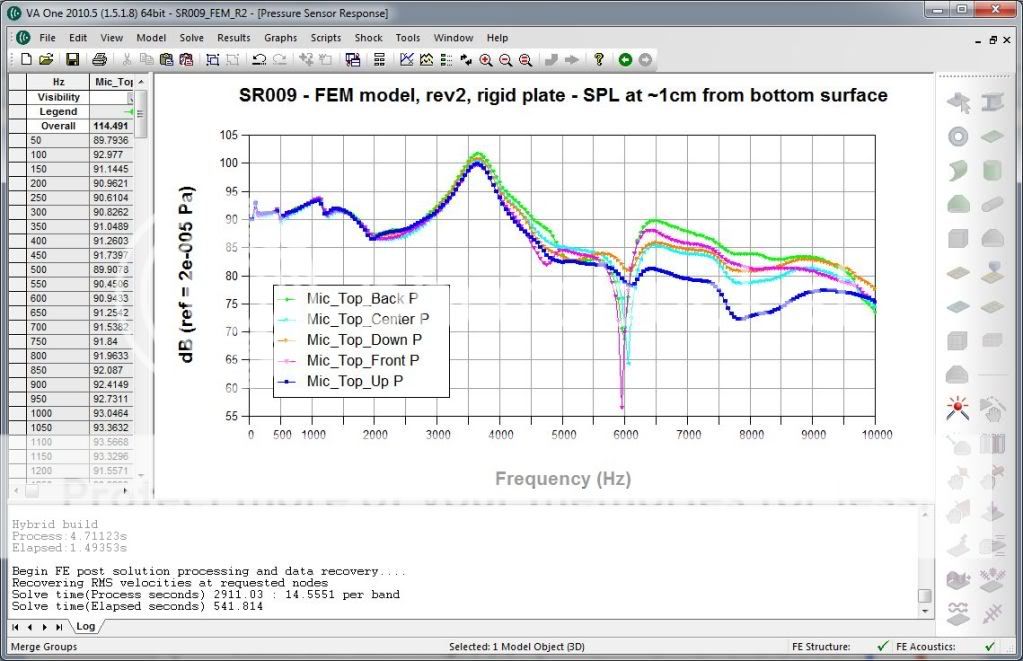
Here is the resulting SPL at some locations ~1cm above the "ear surface" (currently assumed to be a rigid surface, I may be able to add actual dummy head geometry later on). The microphones at above 1cm apart so you can see typical variations as the headphone is moved around:
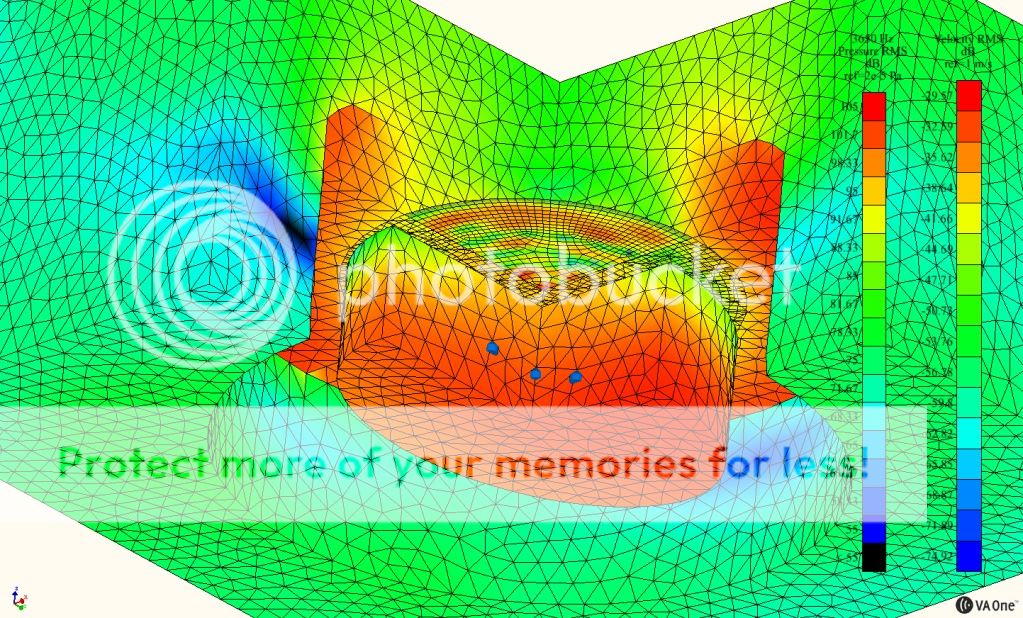
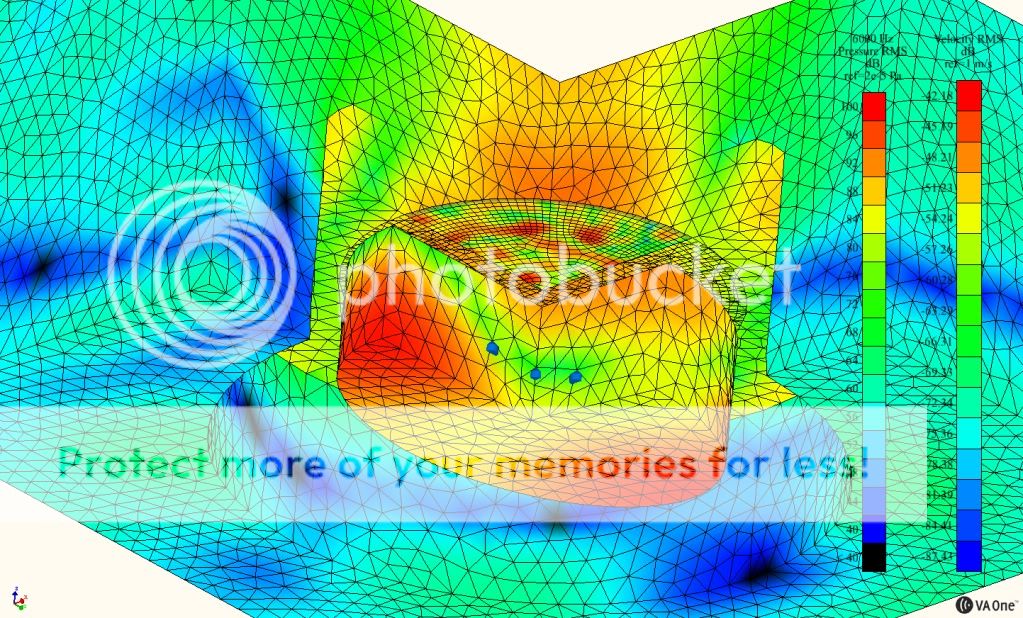
Then, some illustration of the pressure response around the headphone at the 3.6kHz resonance as well as 6.6kHz where you see lobes in some of the microphones response:
Finally, an animation of coupled structural/acoustic dynamics at the the same frequencies. Note that the diaphragm material is bogus as I have absolutely no idea of the tensioning and resulting natural frequencies. I just used a 1.5 micro meter nylon with increased stiffness to simulate the tension and adjusted that to get the first diaphragm "piston" mode at about 50Hz. This turns into over a thousand wiggling modes in the diaphragm by 10kHz...:
http://www.youtube.com/watch?v=_cV_0vsZX38
-
Hi arnaud,
Some references,
The Streng papers and a copy of the Baxandall ES chapters out of Borwick (1st Edition by the looks)
http://quadesl.nl/en/tech-corner.html
The site is very interesting, but then I did have some ESL57s so I am probably more interested than most.
A Download of a late JAES paper on electrostatics
http://lahorde.is.fr...USTICS_HIFI.PDF
A search for documents on the one thing site,shows some the original Wireless World papers
http://www.google.co...=utf-8&oe=utf-8
Linkwitz site on distortion in woofers
http://www.linkwitzl...m/frontiers.htm
I found this page on Linkwitz looking for a reference on multitone testing of loudspeakers. But Linkwitz's work has always appealed to me
A site with a lot of papers on distortion in loudspeakers
http://www.klippel.d...ure/papers.html
Although concerned with conventional speakers, the general discussion is still quite useful.
Linkwitz's use of a 5 tone multitone test, is not a standard method but I find it quite illustrative of how even relatively simple signals get very complex very quickly as the non-linearities create harmonics and sidebands. Perhaps Tyll could took at this as it is well within the capabilities of his test rig. (Ooops, Tyll, I am sorry for referring to you in the third person.) Most of the dynamic phones show the classic rising distortion in bass caused by the increase in deflection and thus non-linearity. How would they compare to say the ES and magnetic planar headphones under this test. The assessment would be necessarilly subjective, along the lines of messy/verymessy/clean etc.
As to the high order modes, I will stop using the term 'breakup' although I cannot think of another descriptive term that applies. I did remember the Bessel functions but Green's always stuck in my head because I had so much trouble with it, I would not even attempt it now. In any case, he uses Green's function in the "Sound Radiation from a Vibrating Membrane" paper - my memory is not so bad after all. In the papers, he demonstrates mathematically that almost all the cancellation occurs within a Z axis of .25 of the radius of the diaphragm, so say within 15mm of a ES headphone.
Ahhh, linear systems, I remember the Quote of Stanislaw Ulam : "Using a term like nonlinear science is like referring to the bulk of zoology as the study of non-elephant animals.” >>>
 )))
)))See ya,
Bob
Thanks for looking these up Bob, I now remember I also have a reference on loudspeaker design (Van Dickason or some similar name) which may have some info. Will look these up.
Green's function is used to solve boundary integral problems so indeed this may have been used to simulate the radiation of baffled plate. The "acoustic near field" is defined as ka<<1 with a the source dimension and k the acoustic wavenumber (2 pi / acoustic wavelength). So, actually, near and far field is a function of frequency. Another thing is that the paper you reference most like looked at a baffled source radiating in free field which again is very different from an small ear cup.
But, anyhow, I have been proved to be very wrong several times when guessing about headphone behavior so best is to simply simulate it, and I have the luxury to do that. The software I use has a so called "Boundary Element Method" formulation which is essentially making use of acoustic's green function for solving a boundary integral problem (radiation of surface / diffraction in an acoustics domain), albeit numerically not analytically (so any shape can be solved not just simplified ones). It turns out it's much more efficient to use traditional Finite Element Method though but I am investigating both ways at the moment ...
Humm, not totally relevant discussion for this thread, sooner or later hell is gonna fall on us
arnaud
-
Unfortunately the diaphragms do not display the pure planar behaviour that we intuitively believe should occur. Streng proved it mathematically using Green's function (Memory?) and then validated the proof with measurements on a test speaker - I must really find a copy of his 4 papers. From memory the modal breakup was somewhat different to the rigid piston model and was entirely of the annular ring form, I vagely remember that the annular nodes actually swept across the diaphragm as the excitation frequency changed. The breakup resulted in localised 'movement of air’ parallel to the diaphragm from the 'in phase' part of the diaphragm to the 'out of phase' part of the diaphragm. One of the outcomes of the work was that a relatively small amount of damping material, close to the diaphragm, 'disrupted the air flow' and damped out the modal breakup - this may have consequences for people who like to remove damping in their ES headphones or who build ES speakers without damping.
Now, if the diaphragm does breakup, the deflection will increase, the inherant non-linearity will increase, the distortion will increase, thus my reference to using IMD (and the not mentioned - THD) to indicate possible membrane resonance. Here is a possible avenue to explore, if a CSD shows a problem resonance and a distortion plot shows a peak in distorion at the same frequency, does this indicate that there is a high probability that the resonance is from the diaphragm rather than elsewhere in the headphone - just a thought, could be wrong.
Hi Rob,
Thank you for your response. I need to think more about this IMD stuff, I guess my work skews my vision as I am systematically modeling linear systems
.In regards to diaphragm "break-up" modes, it's actually Bessel functions of first kind in the case of circular membranes ( http://en.wikipedia.org/wiki/Vibrations_of_a_circular_drum ). Green's function is a completely different wolf and I won't get to it (partly because I barely understand it lol). Probably break-up naming is not appropriate here because there's no rigid body motion of the diaphragm in the case of tensioned membrane vibration (as opposed to the piston motion of an electrodynamic cone before so-called breakup modes catch on).
As for wave cancellation for higher order modes, again it's not that simple when you are looking at headphones because these modes actually radiate energy in the near acoustic field (it just happens to not propagate efficiently to the far field due to the +/- cancellation effect). Anyhow, I am about to create a simplified numerical model of the SR-009 to investigate this as well as the effect of spatially distributed forcing on the diaphragm and possibly to estimate acoustic resonances in the ear-cup. If only someone had some measurement of only the electrode to estimate the natural frequencies of the tensioned diaphragm ......
-
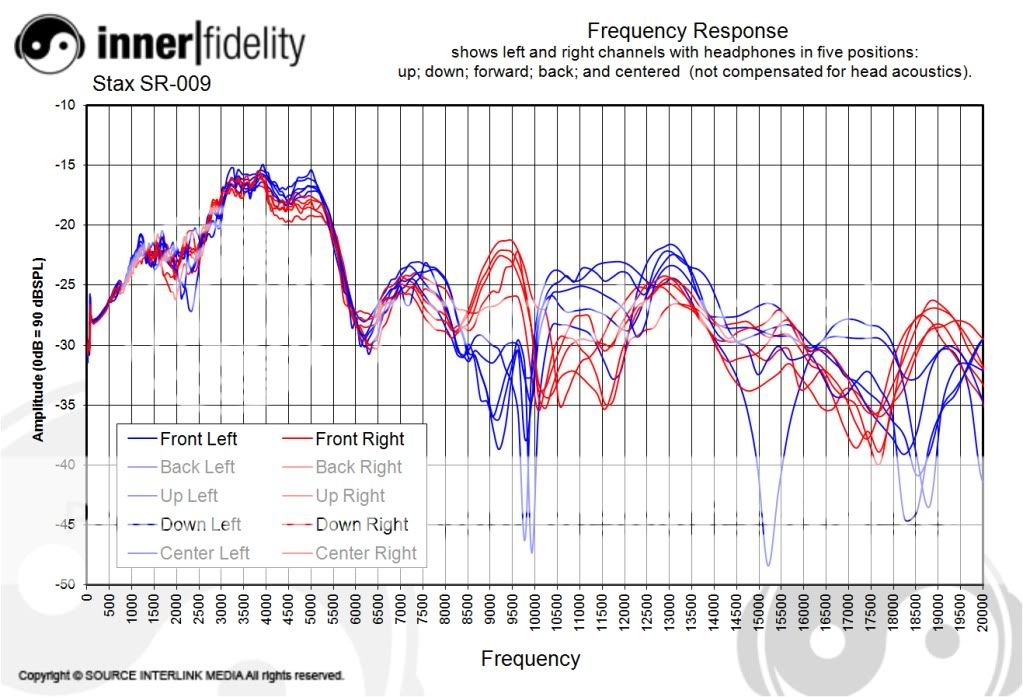
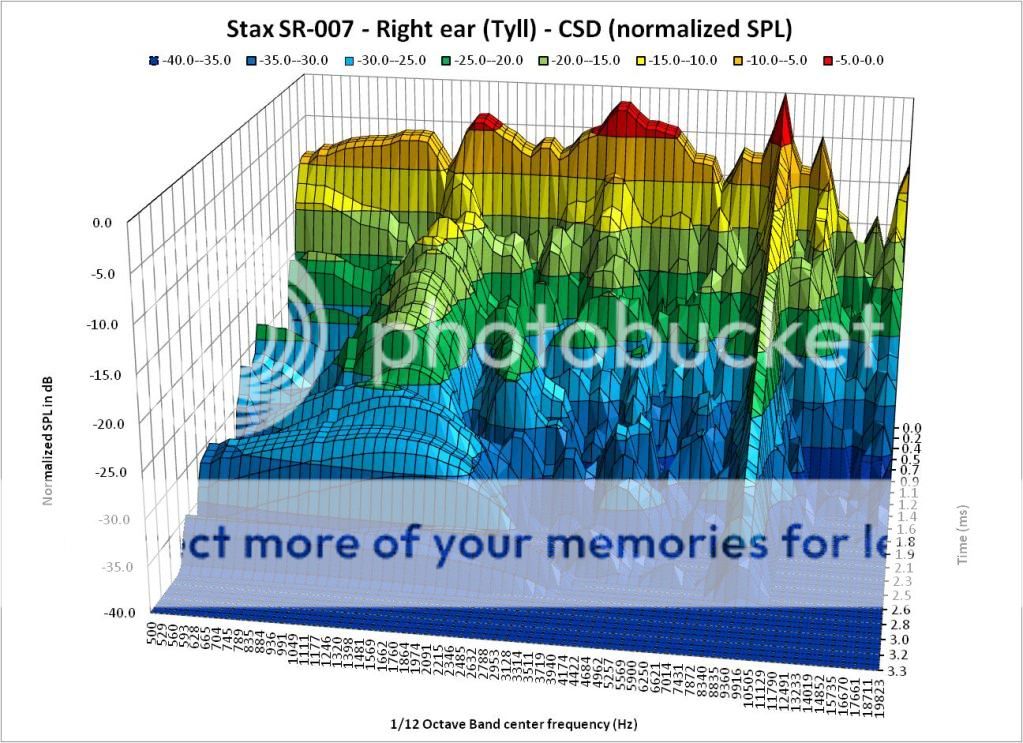
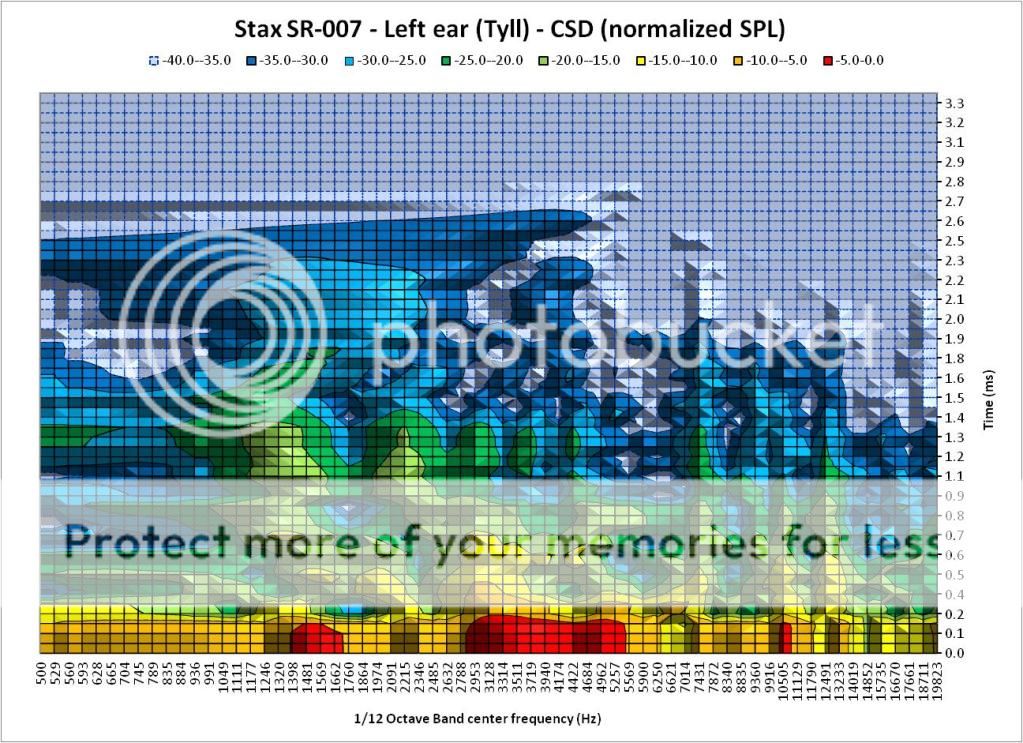
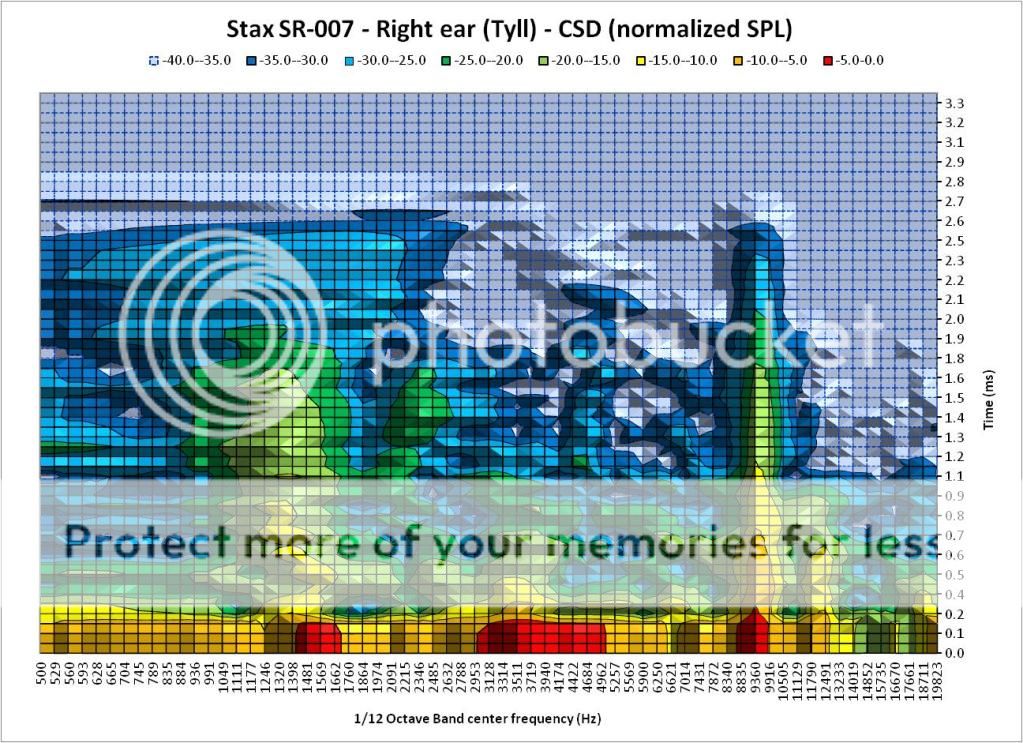
The decay graphs show some inconsistencies between the L&R driver pairings, it's a little troubling to think that some Omega drivers might have a random ringing in the treble.
Not sure it explains everything but there is quite a bit of variability with the fit and - as far as I understand Tyll's methodology - the decay graphs come from a single position measurement (MLS test) of the impulse response. See below a reprocess of Tyll's 009 FRF data:
-
I'm confused, the shape of the frame tells me your left pic is the 007A, yet the gold color of the electrode tells me the right pic is the 007A.
Here's a pic of my 007A (late SZ2):
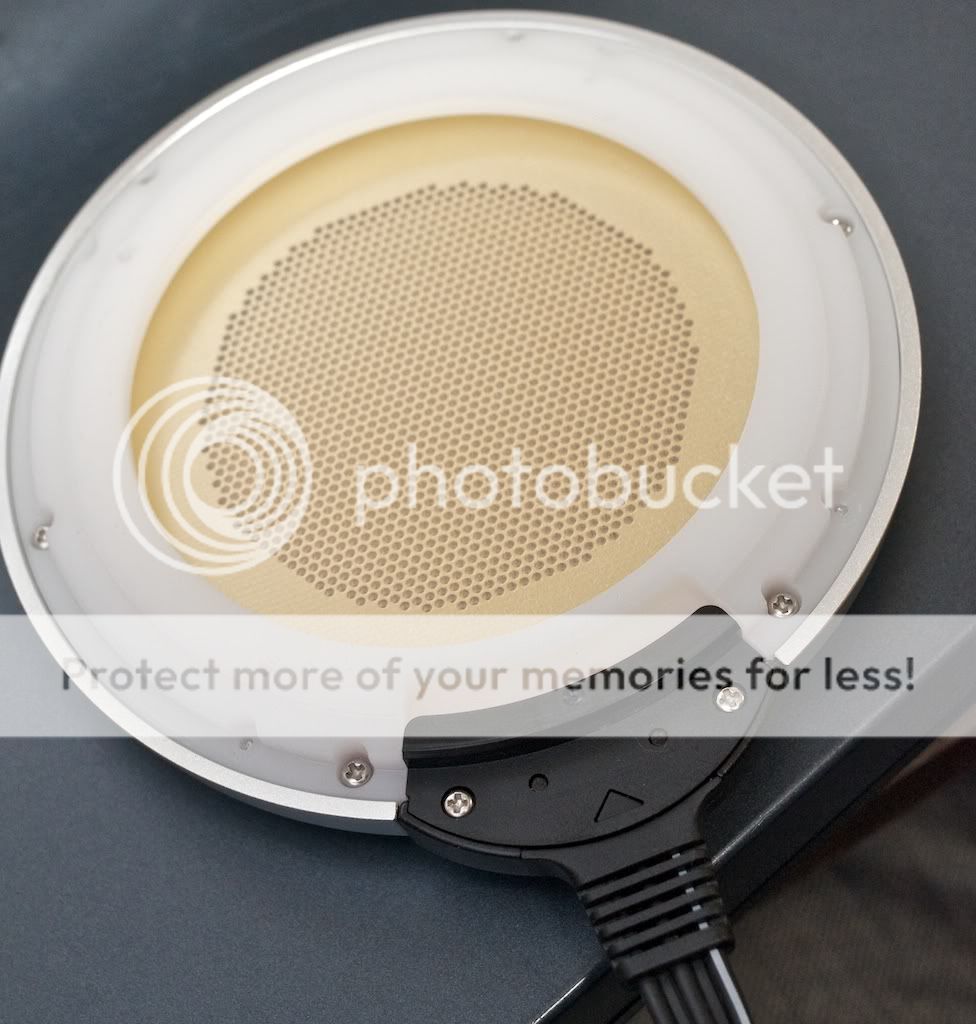
No closeup that I could find and the drivers are packed away in storage. The stators resemble a chain link fence so the copper is woven together.
There is the unofficial Stax site in Japan but they rarely pull anything apart for diagnoses. It takes somebody as insane as me to rip this stuff apart...
Nothing wrong with linking to the nearest alternative but Stax has changed the internal design quite a bit. So the lineage is like this:
SR-007 Mk1 early version (different driver frame plus some minor material changes, older style carbon fiber box),
SR-007 Mk1 late version (the version tested here and the most common of the Mk1's, S/N either 7xxxx or SZ1-xxxx),
SR-007A/SR-007Mk2 (S/N SZ2-xxxx, Stax change the earpads, how they sit and introduce a port to the earcups. Sound is a mixed bag depending on fit but can be fixed to sound pretty much like the Mk1)
SR-007A/SR-007Mk2 (S/N SZ3-xxxx, often called the Mk2.5, Stax supposedly change the diaphragm which results in a much more forward sound signature)
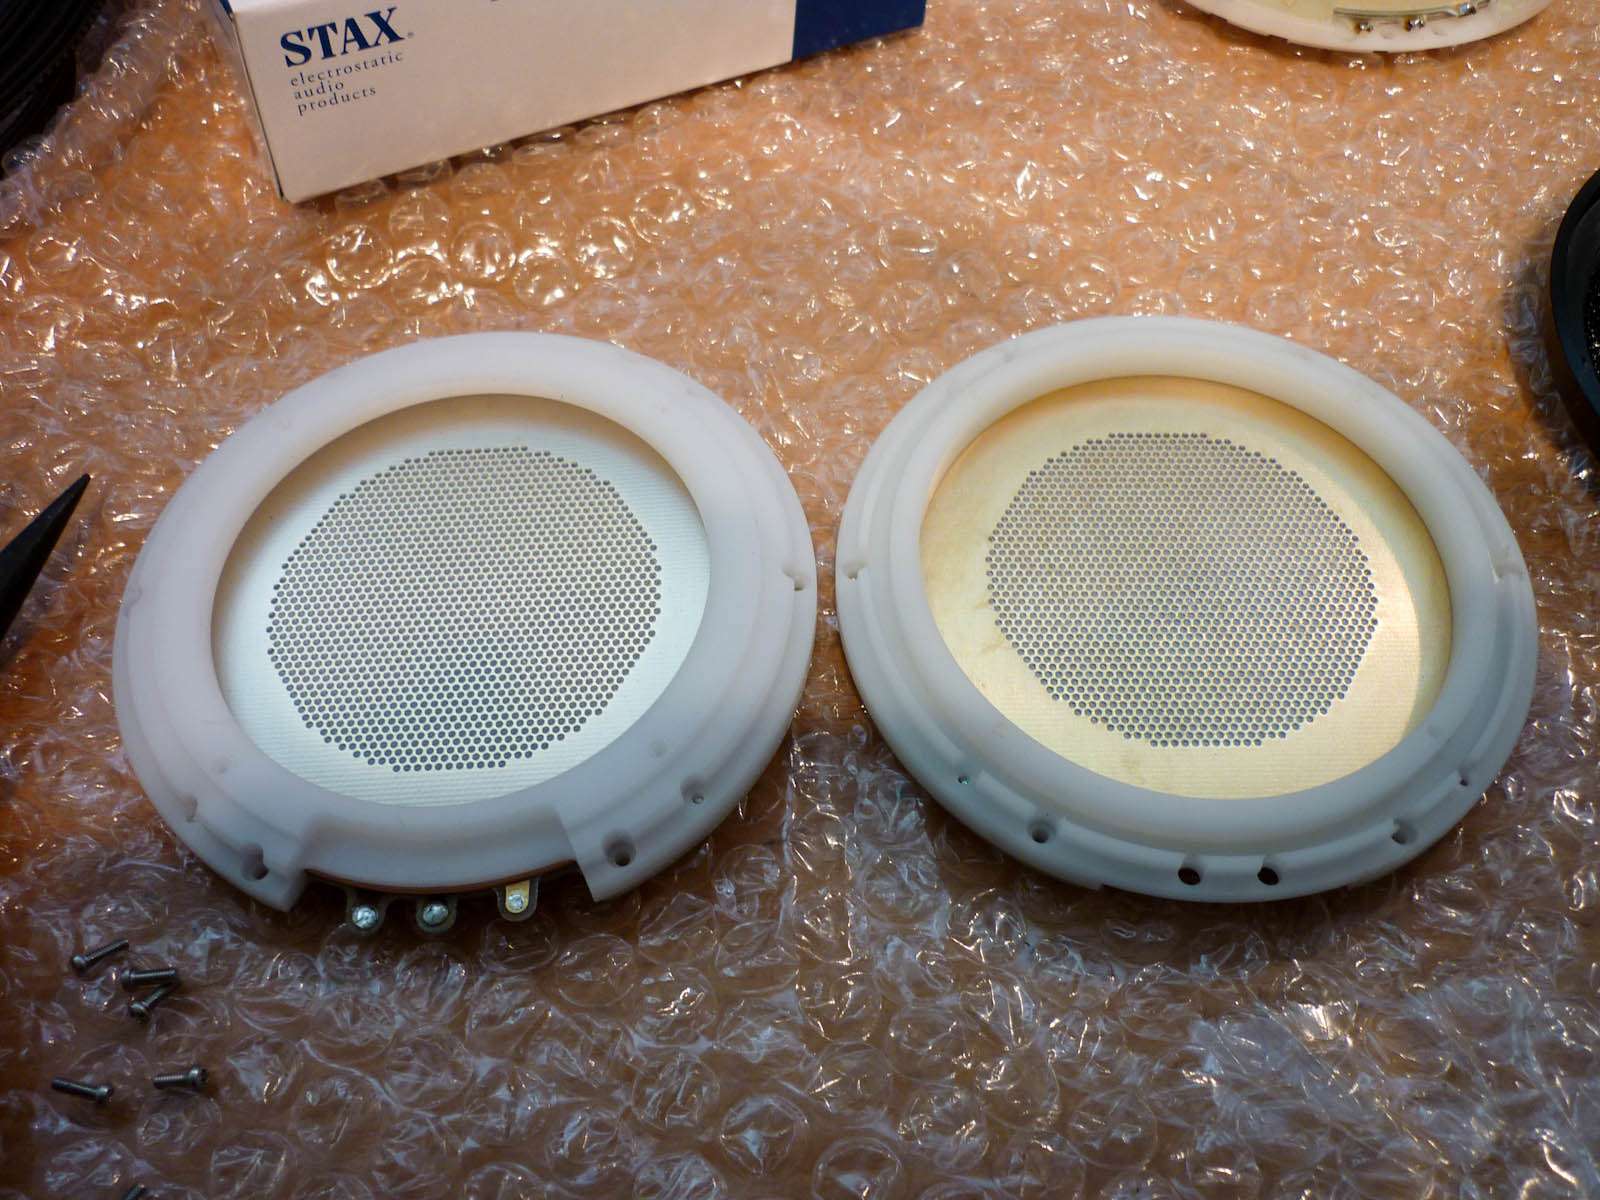
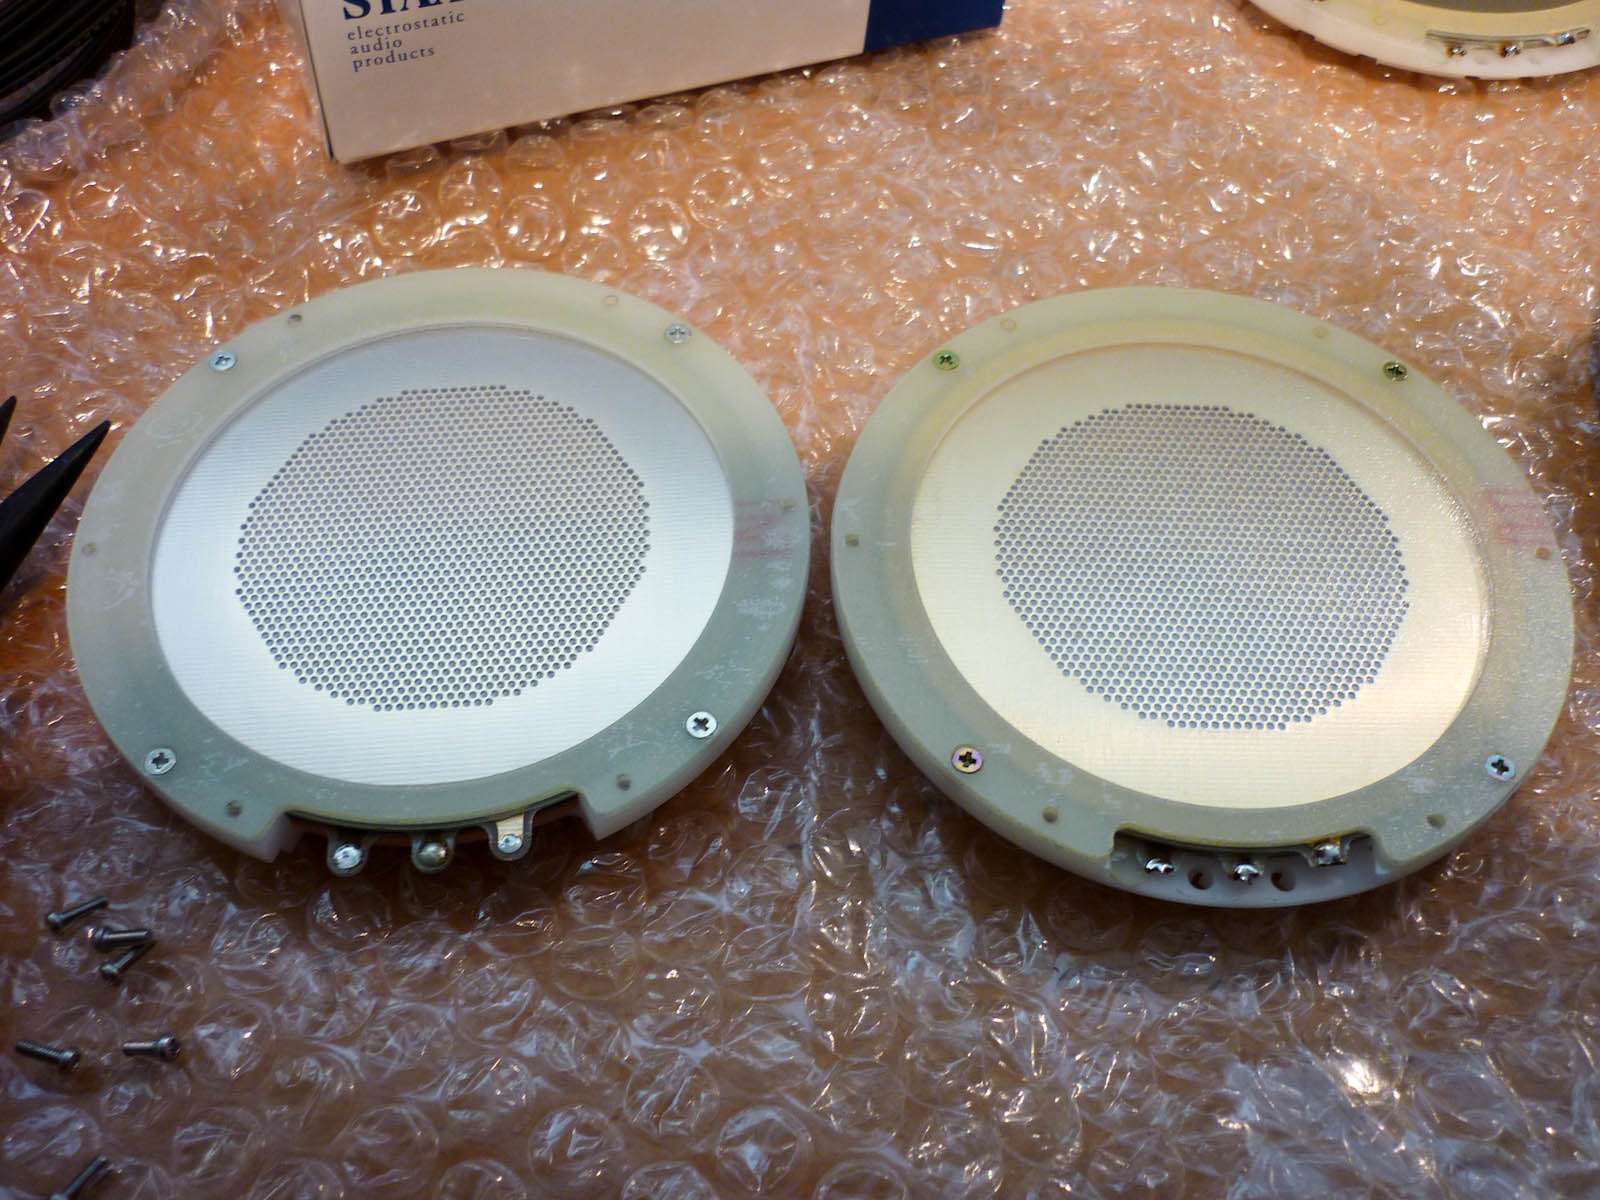
Now you should point out that these are indeed SR-007 Mk1's just for the sake of clarity.
While we are on the subject, does anybody want to play "spot the difference" between the earliest and the latest SR-007 drivers?
-
Edit 9/24: CSD and FRF graphs are now equalized to compensate for the dummy head response (not sure for which heading, does not appear to be diffuse field, Tyll?)
That's it, everybody is gonna ditch their Stax setups in favor of the HD800s!!
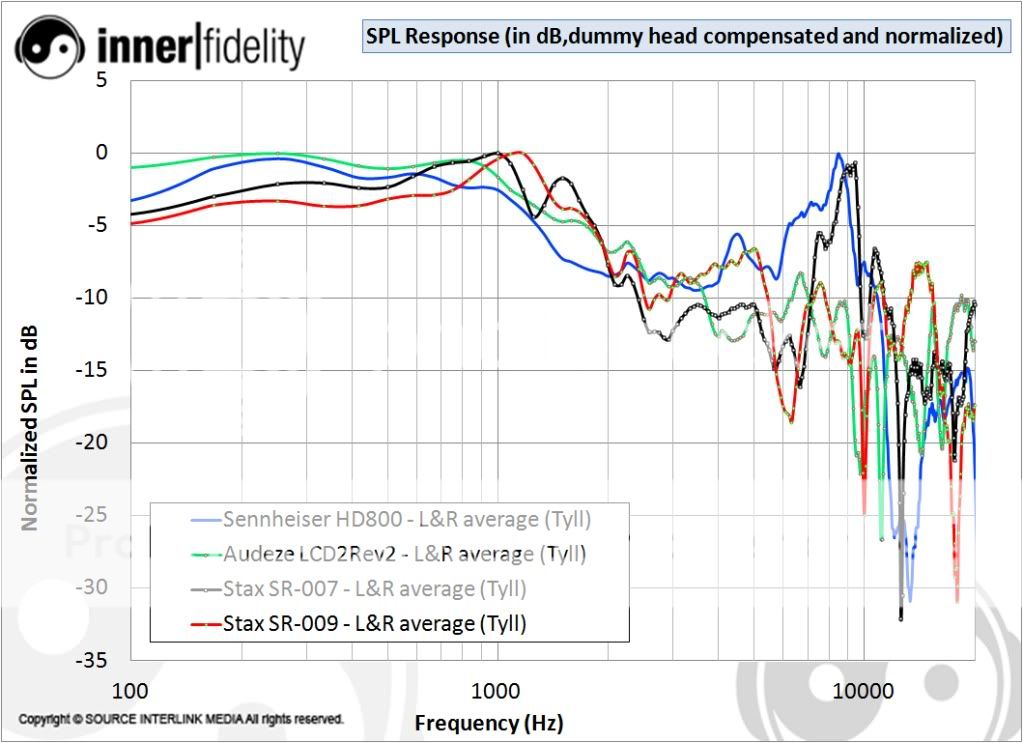
Hehe, I agree that interpreting these results appropriately is no easy feast... The data varies also widely across test setups, maybe because I am processing non-equalized data. As Purrin said earlier, it really only makes sense to compare curves from the same test setup like the most recent 007/009 comparisons and the following...
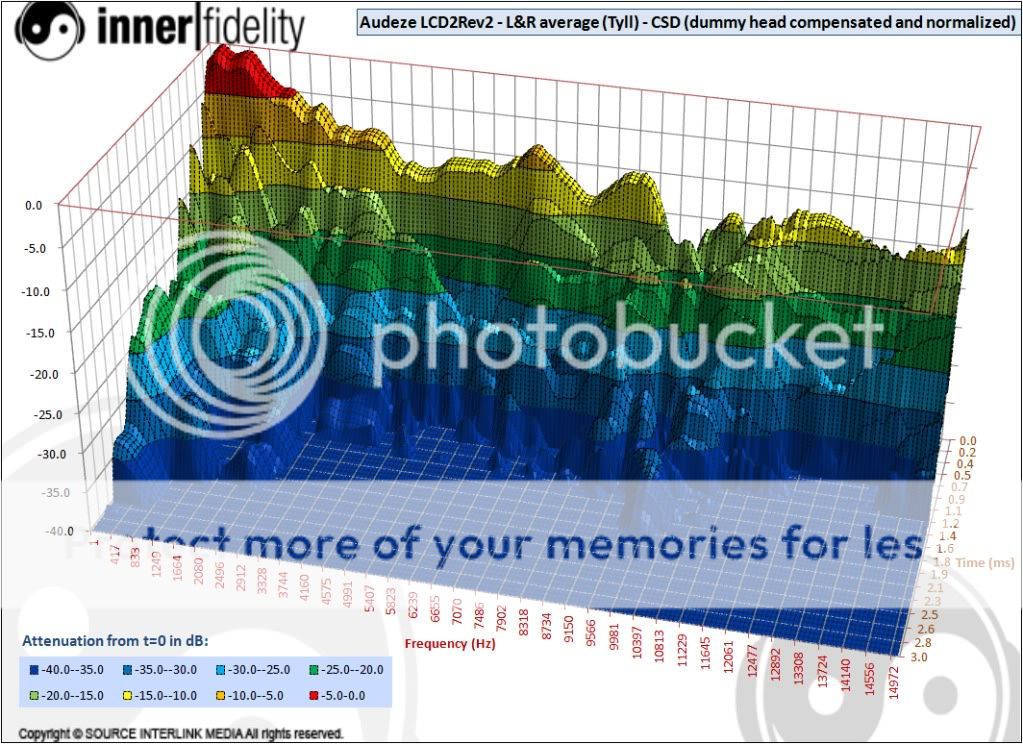
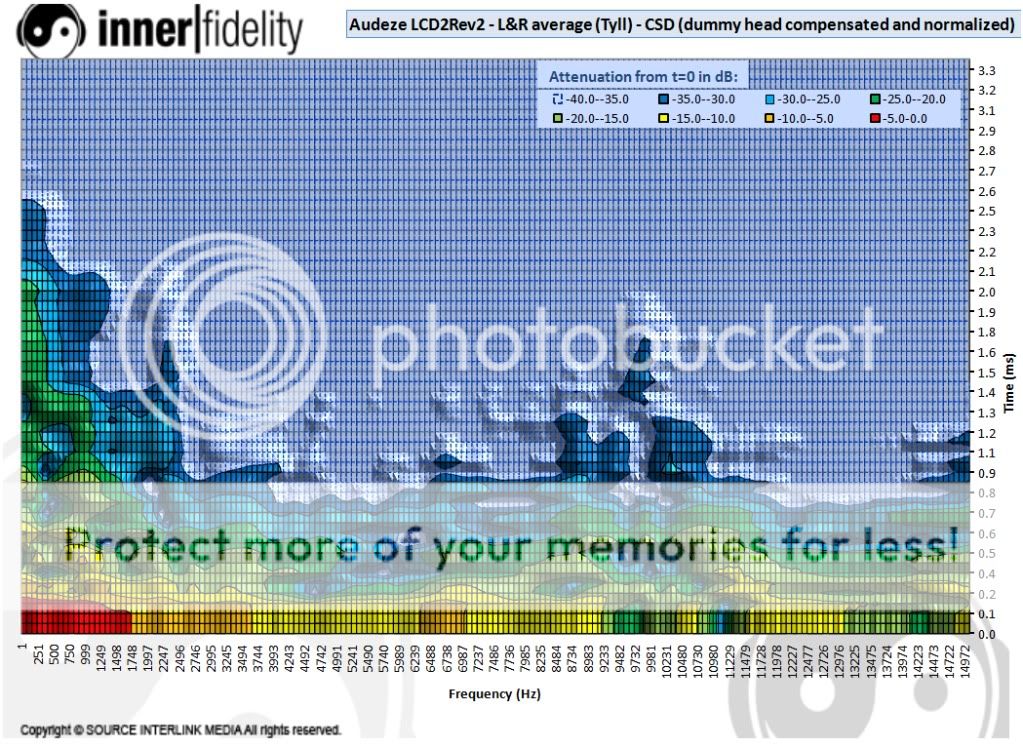
@nnotis: I have Audeze LC2r2 data from Tyll as well so I could generate the comparisons. It gets a bit crowded when comparing all 4 together though...
All 4 headphones:
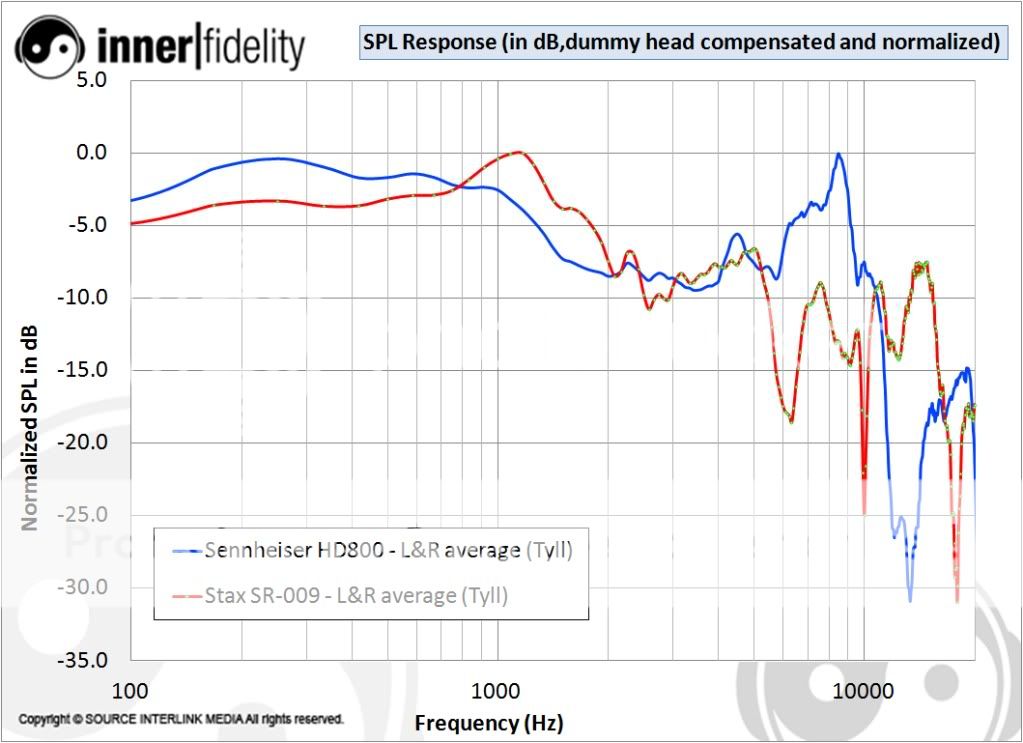
HD800 with SR009:
HD800 with LCD2r2:
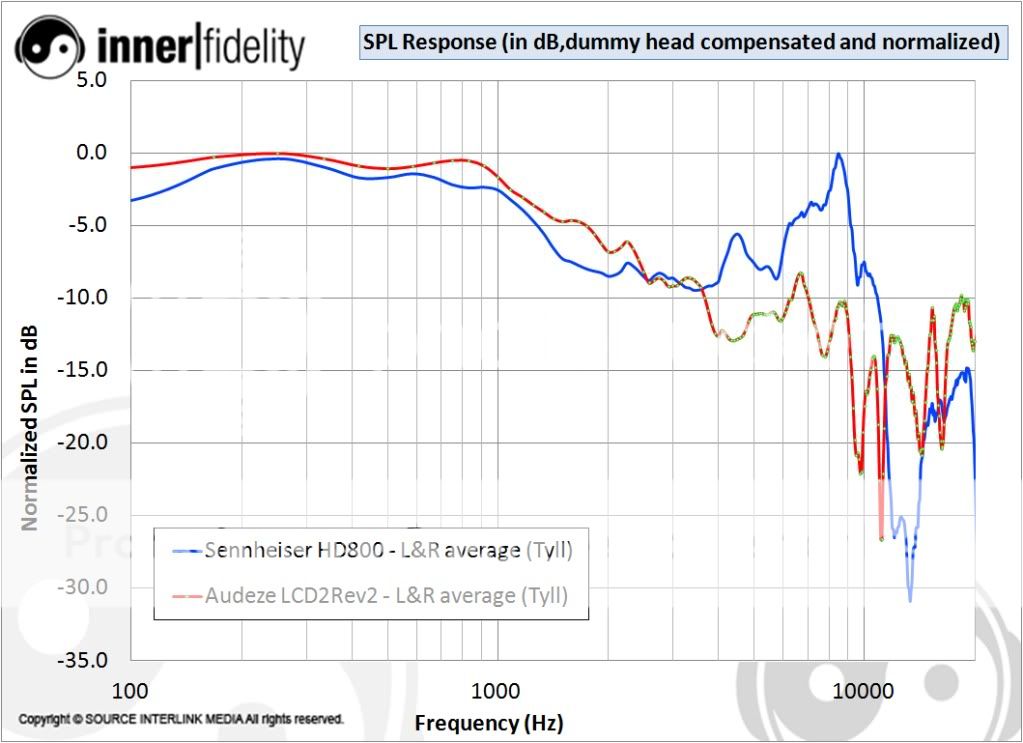
-
Edit 9/24: CSD and FRF graphs are now equalized to compensate for the dummy head response (not sure for which heading, does not appear to be diffuse field, Tyll?)
IRF = impulse response function
CF = cluster fuck
I did a thread about the math a while back. I am on mobile and can't find the link.
Lol, I guessed the F but not the C
. BTW, the impulse response is already in the spreadsheets (MLS test) and that's what I am using to generate the CSD.Tyll, maybe you like these a bit more?
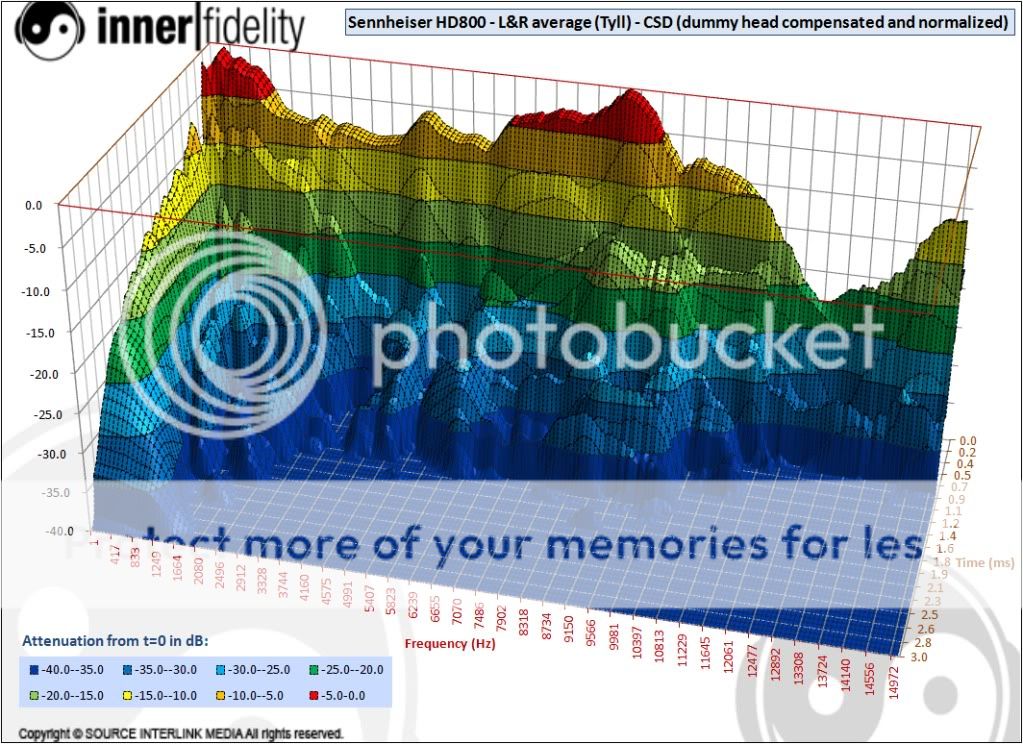
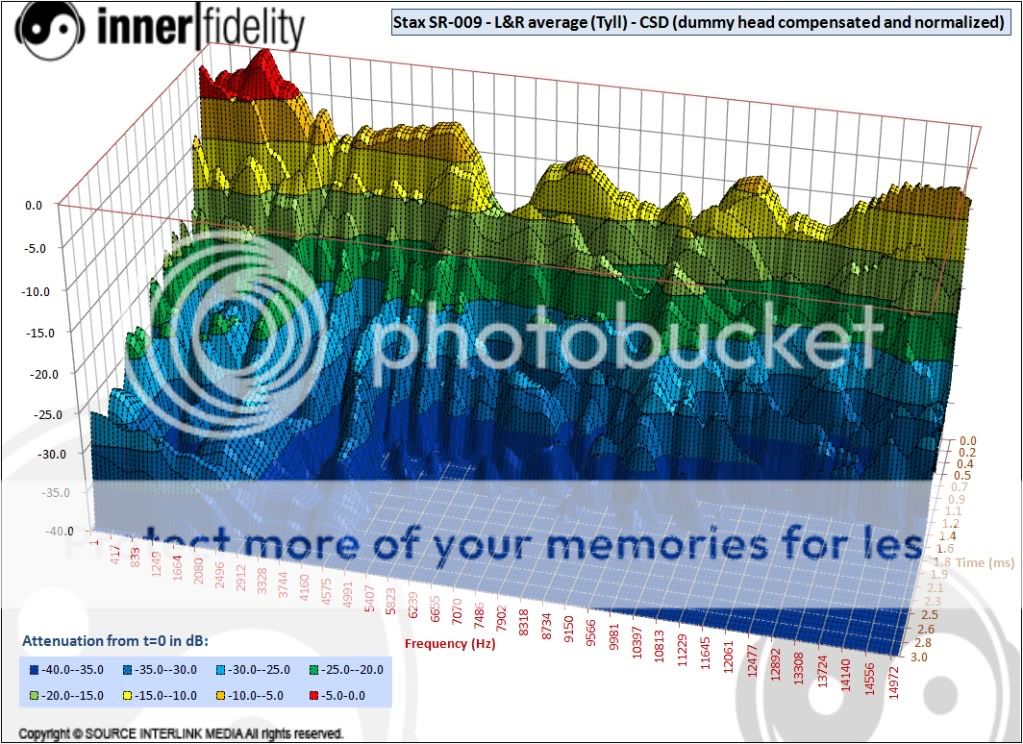
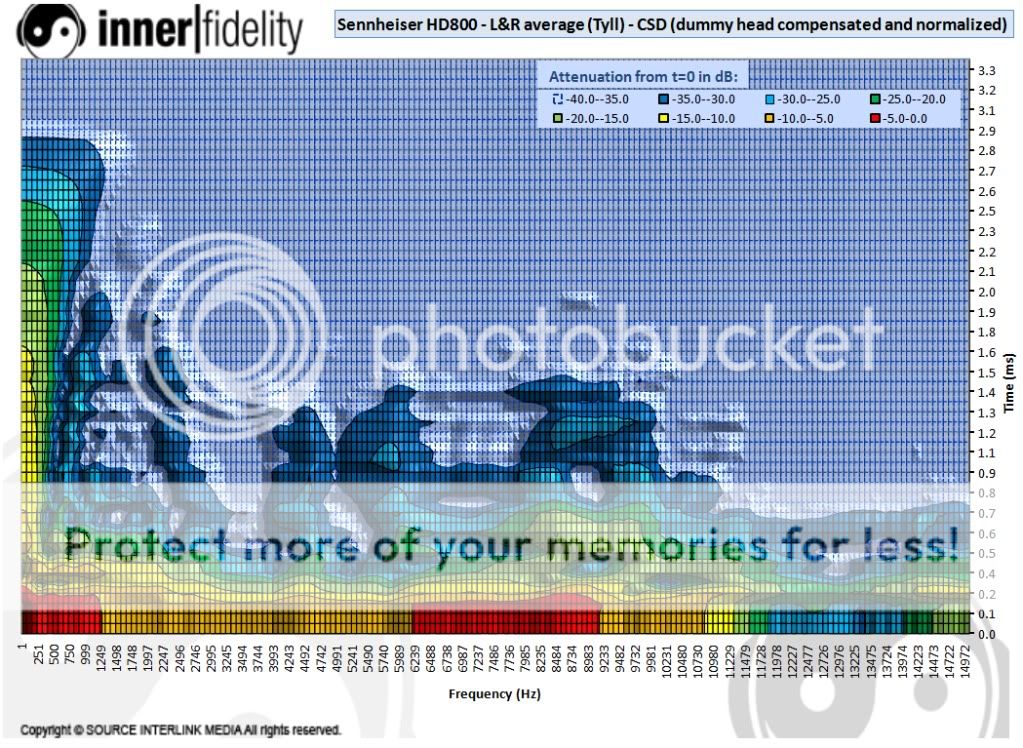
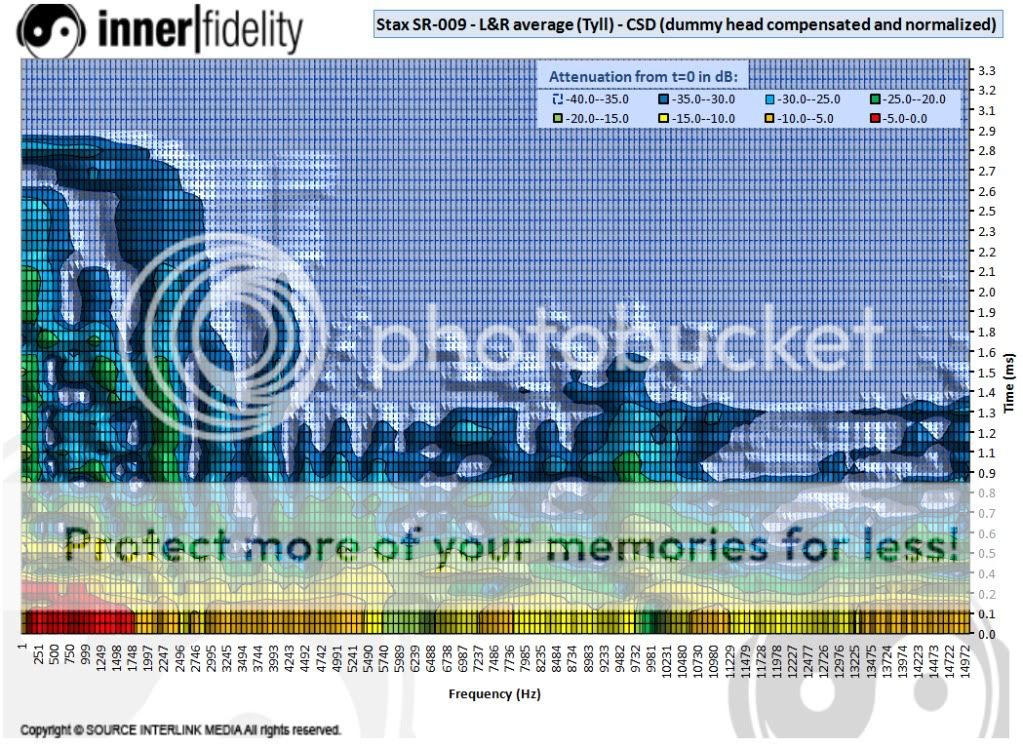
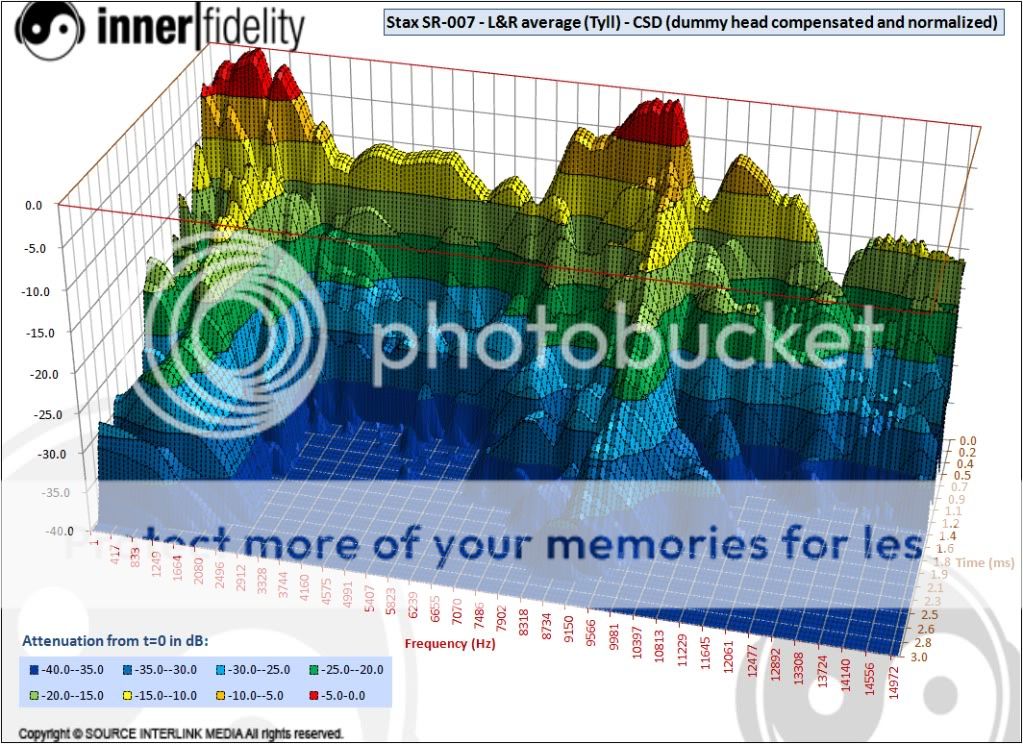
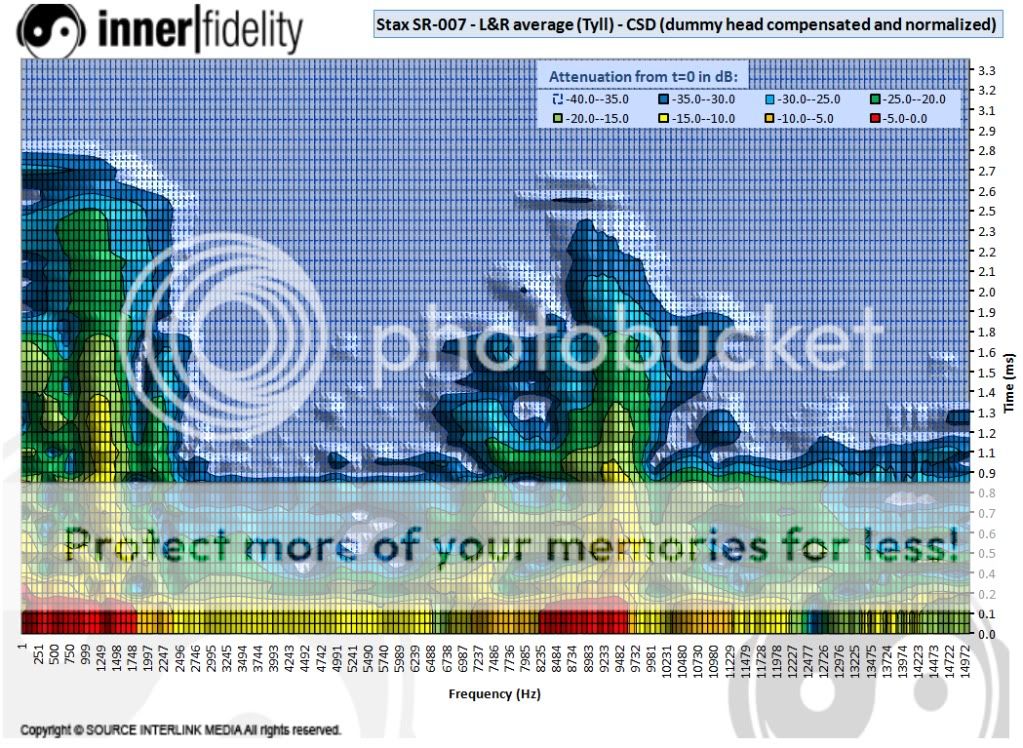
- Results until now were 1/12 Octave Band averages but I now feel these narrow band results are more informative to really guage the sharpness of the ridges and just simply nicer looking (smoother) toward higher frequencies as we keep the same resolution. Only drawback is that I can't make the frequency axis as a log scale...
- You'll notice the Inner Fidelity background .
- These results are now the average impulse response of Left and Right ears
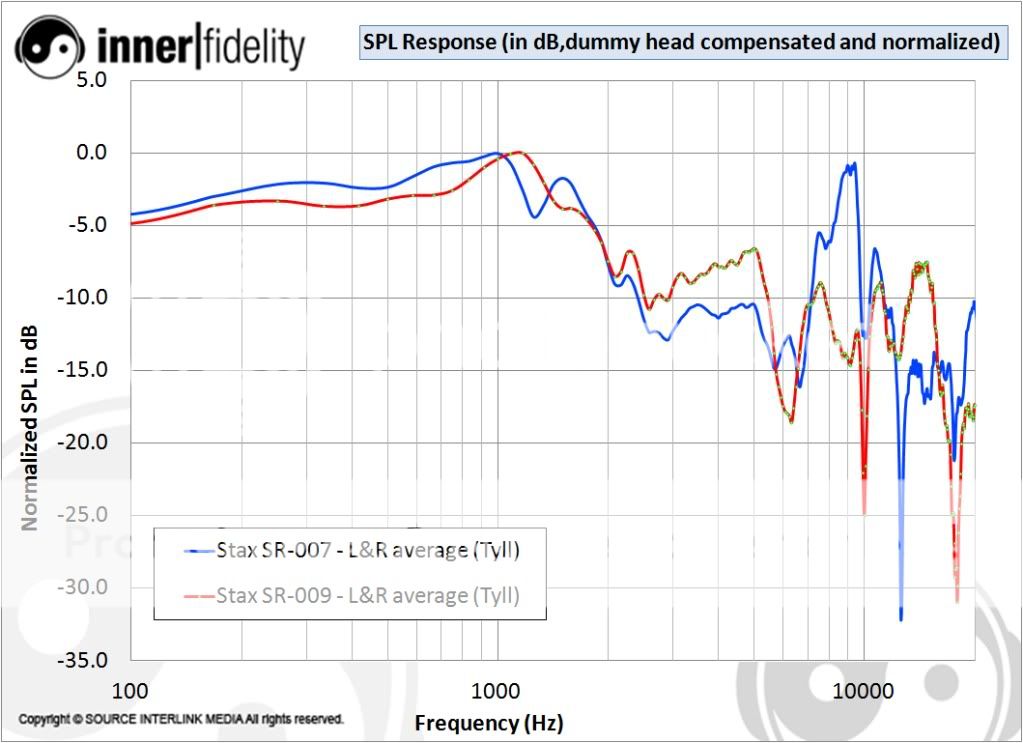
- Finally, I added a comparison of the basic FRF but normalized by the highest SPL which is around 3-4kHz for both 007 and 009. Since this happens to be where our hearing is most sensitivite (well as long as one's ears are not shot ...), I assume this is more representative of what people will feel when comparing both headphones at equal loudness impression. Nonsense?
- Results until now were 1/12 Octave Band averages but I now feel these narrow band results are more informative to really guage the sharpness of the ridges and just simply nicer looking (smoother) toward higher frequencies as we keep the same resolution. Only drawback is that I can't make the frequency axis as a log scale...
-
Tyll, I'd be interested in the hd800 data too...
Dreadhead: what kind of simulation? What is irf and cf?
Neat stuff. Tyll do you have a measurement spreadsheet for the HD800s? I'm going to be off for a few weeks and I may have some time for some math fun and if I have HD800 data from your setup I do some IRF inversion fun and see if I can model the SR009. Not that it's fun to many but since I spend most of my time wrestling with a giant CF software mess some elegant programming is fun at times.
-
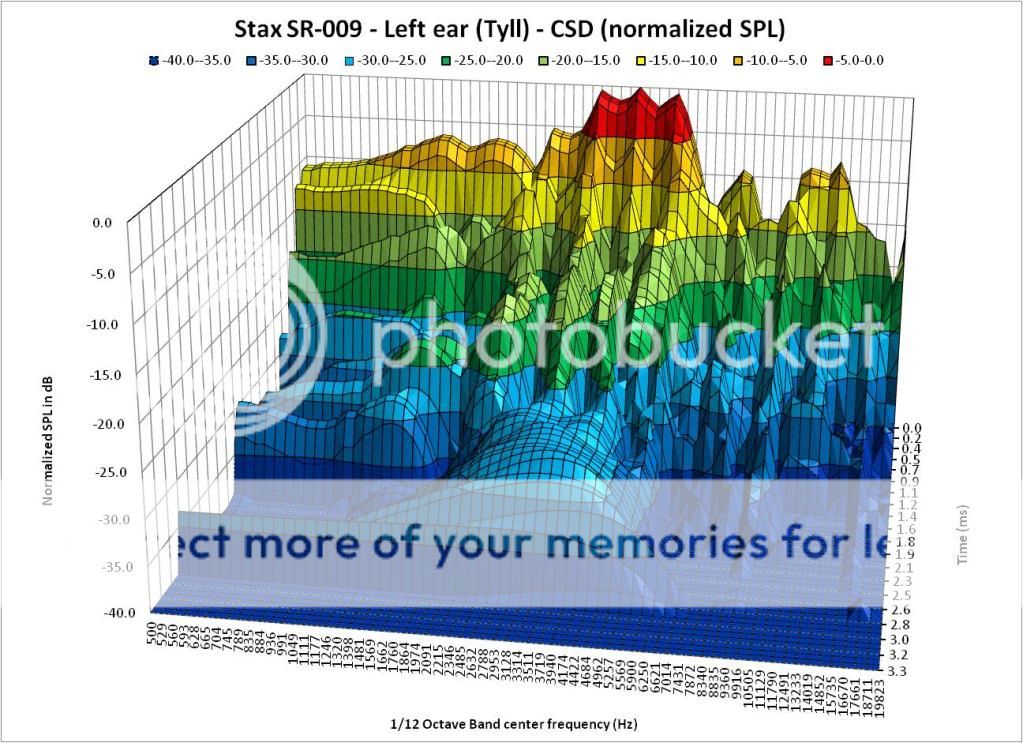
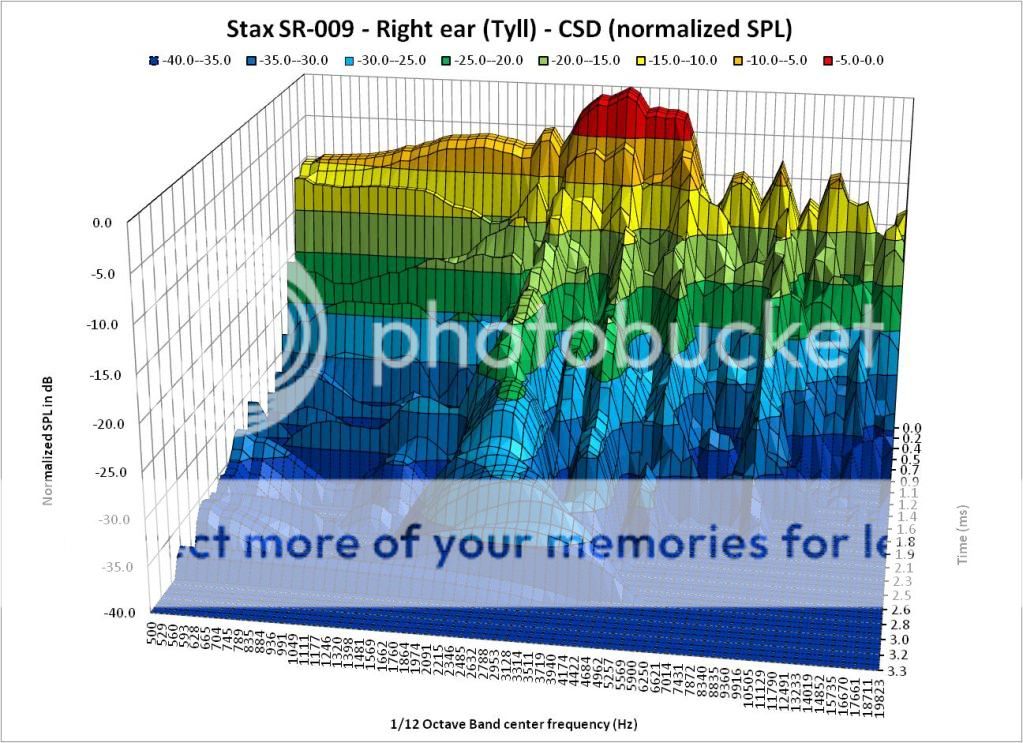
Hope this pleases the Stax Mafia: http://www.innerfide...ne-measurements For the geeks out there, I've made the spreadsheet available. SR-009 and SR-007
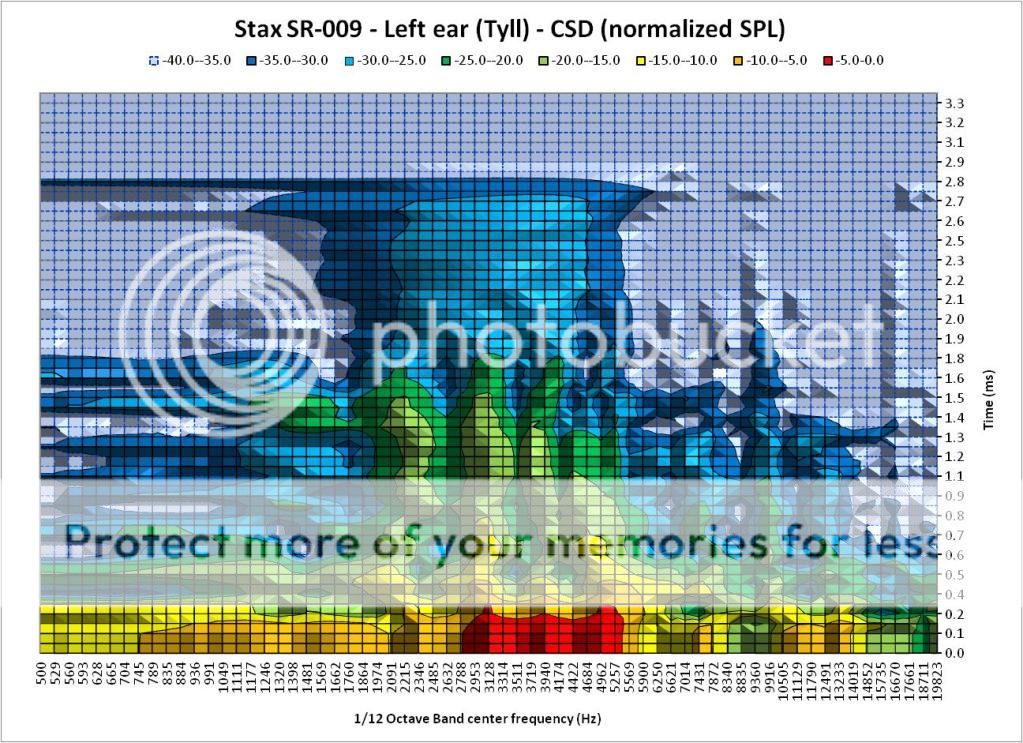
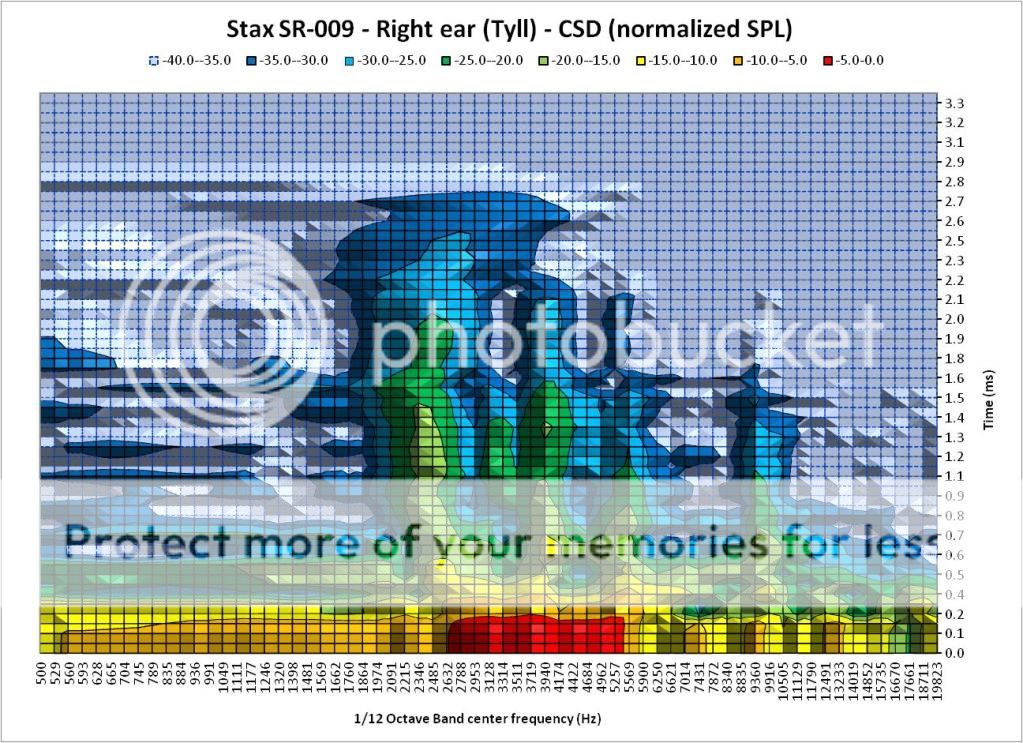
Hi Tyll, brilliant! The geek in me could not resist and generated the graphs (I love this Excel automation stuff
). Did not check in detail, but first look is that the 009 does have some resonances in the midrange (1-4kHz) but they're better damped than the 007 peak at 8-9kHz: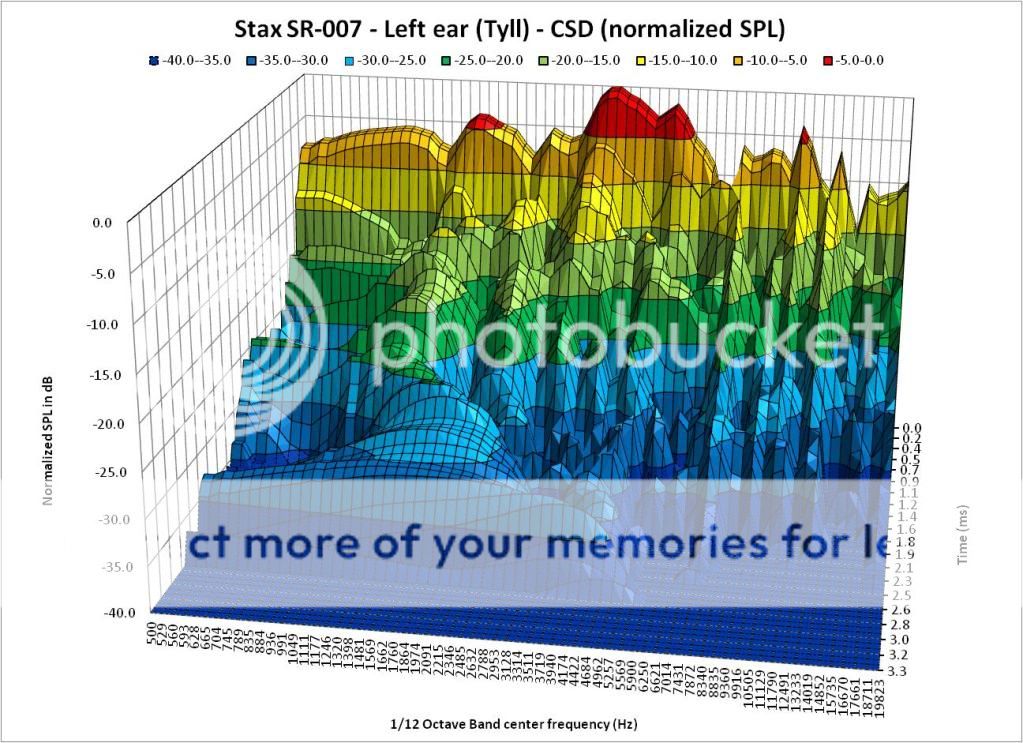
-
The man himself posted before I hit the post button
. Forgive me if I did not introduce your work as nicely as you did.BTW, I'd still be happy to help if you get a chance to do some measurement with longer time window. Looks like you're very busy listening to the 009 at the moment though, which is understandable
. Hi Bob,
Thanks for your lengthy, and obviously well informed post.
In practical terms, my goal is to provide consumers and enthusiasts with a database of objective data to compare when shopping for headphones. You can find my current measurement set here. A couple of the guys have been playing with CSD plots, and I think they are visualizations of performance that may be useful for laypeople in evaluating cans. This thread is simply us trying to figure out how to possibly include them in the work that I'm doing at InnerFidelity.
I appreciate the more complex studies you highlight, but it is likely beyond my ability to pull off given I've also got review articles to write. The measurements you suggest may also be more complex than non-engineers can usefully interpret.
So, to some extent, I have to look at this adventure as simply getting a good basic set of measurements for folks to compare, and leave the complexities for some time later.
Still, talking about this stuff is good fun, and your post is interesting. Thanks for that, and feel free to stick around and join the fun. I'll caution you, however, that Head-Case is not your normal headphone forum. We all know each other quite well here. This place is really more a club house for a group of freinds that happen to have a common interest, than a headphone board in the normal sense. Your technical contributions are likely to be quite welcome, but it is your potential as a freind that's more important in the long run. I simply ask that you please be sensative to the fact you are entering a dialog where people know and love each other well.
Thanks mate, welcome.
Tyll
PS Sorry about your gear, dude. That sucks.

-
Dear Bob,
Welcome and thank you for your informative post, I would like to read up on the reference you posted. You're referring to people who published at some previous AES conference or?
I am a bit curious as to what you are trying to achieve with these measurements. Is this an attempt to correlate possible audible effects to measured effects, i.e. resonances to colouration?
In regards to CSD, I guess the one and only point is to get an idea of how damped the various resonances are, with the idea at any sharp / long ridge in the time axis should be quite audible as a coloration.
You guys are going to quite a lot of effort to get together a large collection of ES phones but have you worked out exactly what tests you are going to perform and how you are going to do it? This is not criticism, I am genuinely curious and quite excited by the prospect.
I am not sure how familiar you are with Tyll Hertsen's recent venture and he will explain better for himself but the idea is simply to reproduce the same bench tests as he does for all the headphones he gets his hands on. As I know, these are "standard" direct dummy head measurements of headphone response with various input signals / post-processing. CSD would be a new result if Tyll can get to it.
One of these would be to exploit the reciprocity of the electrostatic transducer and use it both as speaker and microphone.
This is interesting. In the case of ES driver, isn't the blocked impedance just the capacitance of the driver and resistance of the cable? I agree that due to strong electro-acoustic coupling, any acoustic resonances / diaphragm resonances will show up on the electrical impedance curves but it sounds like the measurement of blocked impedance is only practical for an ES driver? I like the idea of extracting a radiation impedance from these two measurements though, would like to read more on this.
Note that the prime objective of the current tests is simply to get the SPL at the entrance of ear canal for a "standard" dummy head, possibly normalize it based on the heads calibration HRTFs, and use the result as part of a database to compare different headphones (including electro-dynamics and other ortho types...).
One of the problems with this method is that it gives best results (from a designers point of view) when the transducer is radiating into an empty room - well at least one member of this forum seems to like pulling his expensive ES headphones apart. >;-)
You're referring to ES speakers with unwanted room resonances here no? I don't see how headphone response without the proper acoustic load (e.g. dummy or someone's head) can be of any use if just to see some diaphragm resonances?
Other tests worth considering are the distortion tests, especially a swept Intermodular distortion test (IMD is sometimes referred to in loudspeakers as Doppler distortion)
This is interesting too. I believe I replied in the CSD thread I did not understand the purpose of IMD test for headphones (or passive speakers for that matter) because I can't imagine how these distortions can be significant in passive devices? You're referring to "modal patterns". While I understand you could excite higher order modes at a given frequency, these are still responding at the driving frequency, not their natural frequency. So, there won't be any IMD to speak of, where am I getting mislead here?
This test can often reveal unexpected diaphragm behaviour like the modal patterns shown by Streng in his papers (something often ignored by ES designers or their marketing departments - I notice that Wiki still implies but does not state the fallacy of pure planar behaviour).
Do you mean here that those thin tensioned diaphragms have loads of "wobbling" modes and responding nowhere near uniformly? This I can't imagine at this time since the ES force is spatially distributed over the surface and I assume (?) inertial forces of the diaphragm are minimal compared to this ES force?
(many modes have little net output as the positive nodes and negative nodes tend to cancel each other out [see Olsen, Berenak etc] and may not show up very prominently on CSD plots).
Again, this is true for speakers but here's we are measuring in the acoustic near field of the drivers, which is a very different business. While it's true that all these higher order modes don't propagate in the far field (just sloshing air around), aren't they going to be picked up by the nearby microphone in dummy head test?
Unfortunately, I am not in a position to help. I am currently traveling around Australia in the a motorhome (year 7) and have none of my library on ESs with me.
Too bad as you seem to have a lot of interesting papers to share
.I should have brought them with me as a disaster last year has seen them and a great deal of other HiFi gear (which I had in storage) completely destroyed - some of it was practically irreplaceable - older, collectible stuff - often impressive to look at, some of it quite beautiful, and the odd bit here and there occasionally even sounded good.
What a shame... You seem to take it rather easy though, I would have gone probably nuts
There are copies of PDF copies of Borwick 3rd ed floating around on the internet so Peter Baxandall's work on ES is available but this seems to have changed considerably from what I remember of the 2nd ed. I have not been able to source the Walker, Streng, etal papers off the internet. The Streng ones originally published in the Philips Technical Review are most interesting as they led to an experimental segmented ES loudspeaker that was shaped (from memory) as an isosceles triangle.
Thank you for the hints, I will start from there...
-
The SR-009 will have plenty of fans but I'm starting to miss the SR-007 smoothness and more forgiving nature. This is mostly due me putting Foobar on random and it digging up all kinds of crap...
Similar thing for me. I was mesmerized at the beginning since I was using select recordings. Then was the phase of playing random tunes in my library and trouble started. IMO, there's no free lunch and both Omega 2 and 009 are basically complementary for this type of issue.
I went back to doing headphone simulation as it had worked pretty well for the HD800 (to identity the 6kHz peak for instance). I'd like to give it a shot with the 009 and see if the new shape of the enclosure has any bearing with the new forward acoustic signature. But per your message spritzer, you feel it's more of an effect of the newer generation diaphragms (507, O2 SZ3)?
-
oh, and Grado "Labs" is such a fine example of how to stay ahead of the curve...
ouch, that hurts.
-
Still on the road, but thanks for your thoughts on this. I'll look at it closely when I get home early next week. Thanks mang!
Sounds good Tyll. BTW, I know I am not "supposed to" but I paste her a discussion with Purrin's from the HF thread on CSD measurements, in case you're not visiting there. Bottom line is that, after thinking about Marv's setup, I believe there's very little chance for your and his CSD results to have much resemblance:
------------------------------------------------------------------------------------------------
Marv, I reckon you started doing these tests on regular dummy head data and then found out you got cleaner results with your current anechoic termination test rig.
While I thought this was a great idea at first, I am not sure of the meaning after thinking a bit about it:
- There does not seem to be a fundamental issue with using a standard dummy head (see my CSD post-processing of Tyll's data)
- Headphones are (for the most part, grant you the K-1000 is a different beast) designed to feel an acoustic load forward of the driver (e.g. the acoustic chamber between the driver the ear due to earpad spacing).
I see several major issues with the anechoic termination test:- As you pointed out, the low frequency part of your CSD plot has little to do with actual performance. (that's regardless of open or closed design, being in the acoustic near field of the driver, e.g. it's almost like doing an IEM test without a proper seal)
- The anechoic termination completely changes the acoustic resonances of the enclosure (from a sort of rigid boundary condition to anechoic one, acoustic resonances will shift down in frequency VERY significantly, by a factor of 2 for example). This will be seen up to very high frequency because such acoustic resonances occur above 2kHz.
- The anechoic termination adds significant acoustic absorption in the front chamber (ear to driver, bounded by the earpad) so the acoustic resonances of this region will not only be shifted in frequencies but also significantly damped so you pretty much won't see them in the CSD plot.
Have you thought about going back to standard dummy head measurement now that you got more experience with CSD testing? I understand you might want to isolated the driver resonances from the acoustic chamber but in this case, extracting the driver (like you did with the SR80?) or better yet, doing a laser vibrometer measurement on the diaphragm (can you get your hands on that ?
) would be suitable.------------------------------------------------------------------------------------------------
- As you pointed out, the low frequency part of your CSD plot has little to do with actual performance. (that's regardless of open or closed design, being in the acoustic near field of the driver, e.g. it's almost like doing an IEM test without a proper seal)
- There does not seem to be a fundamental issue with using a standard dummy head (see my CSD post-processing of Tyll's data)
-
While the testing should easily show the difference between a SZ2 and SZ3 then the results of these sets could be wrong given how demanding they are of a correct fit. My mods to the Mk2/A's can be skipped simply by getting the fit right (well about 90% of the way) which would cause issues with measuring.
That explains... I always wondered how much the typical issues with 007A's bass overbloom were coming from improper seal. At least for me, I felt the proper seal made very significant difference in how clean / tight the bass sounds - regardless of using a non-linear amplifier
. Good news with the 009 is that I don't experience such sensitivity to fit and it basically fits like a glove... -
I thought 007A was the naming for domestic market (mkII overseas)? In any case, I have no issue sending mine as another point of reference (late SZ2 series, SZ2-16xx). Shouldn't cost more than 50USD to ship to, problem is shipping back...
-
Hahaha. 10 different ways of doing the same thing with most of them not working. Sounds like MS.
Yeah, this is a reminder of the worst years of Microsoft when they used to cram all sorts of options in some sub-menus. It's getting much better recently though...
As for the user manual at hand, there is one place I found which may be a potential culprit (see exponential settling in page 431 as part of the sweep testing settings). Maybe it's set to perform some exp. windowing in the last ms or so?
Tyll, I will need you to clarify how you are exporting / generating the MLS result as this interface is an utter confusing mess (I now understand why you had to run away with your bike for a week lol
). My (poor) understanding of how this thing is setup goes as follows:- The MLS sequence (output of your front end, feeding the headphone amp) is generated by a DSP as opposed to traditional analog signals so you must assign it a D/A sample rate and it must match that of the signal analyzer (you're using 65kHz)
- The microphone data is recorded back and can by viewed as is in analog domain (going through a 10Hz-22kHz bandpass filter though)
- However for MLS processing, the system actually needs to perform FFTs so it's digitizing the analog inputs, in which case you must set the sample rate to match that of the MLS signal generation (not exactly sure why, but I guess it's to guarantee that the MLS sequence does correspond to the acquisition window (as it's not quite fully random signal). In your case, you don't only want to see the result on the screen but also record the data so it must be digitized regardless of the post-processing or not.
- For some reason, you're then having to setup a time sweep recording in order to perform the MLS acquisition. In that panel, you're actually overwriting all previous sampling settings above as you're specifying the time step (=1/sample rate) and start / stop time (acquisition period = 1/ frequency resolution of the resulting fft). From trying to decipher the manual, what's happening in the background is that the thing is actually decimating the data and sampling at much higher rate than you're specifying in the various menus.
- As a result of this mumbo-jumbo, it's coming up with a 3ms impulse response with an apparent 170kHz sample rate.
The only recommendation I have after reading the manual is no different than the first one - you should try to modify the sweep panel settings which really is the only thing that controls the estimated system impulse response from MLS:- Keep the MLS sequence to 28k length, 65kHz D/A
- Keep the digital analyzer to 65kHz A/D
- Get at the very least 6ms of data in the time sweep panel, which is sufficient to see the ringing of most headphones (this will give a resolution of 165Hz (1/0.006) but this can circumvented by zero padding the data). I would go with 12ms (we can always zero out room reflections later if need be).
- You could probably reduce the number of steps as the current settings are a bit overkill (apparent 170kHz sample rate, I was using 1 in 5 samples to generate the CSD graphs). But since we're better safe than sorry, I'd say go with 2047 steps for 12ms which will be the same rate as currently (for a fast headphone like HD800, it might be nice to have that kind of bandwidth). BTW, my current spreadsheet reads 2048 samples.
- I doubt there will be issues with reflections from the walls of the test cell, you're using pretty thick liner I believe? In any case, as mentioned above these reflections can be removed from the impulse response afterwards (except if they're swamped in the middle of headphone reflections, in which case you gotta accept this or move to larger test cell).
hope this will help you...
- Keep the MLS sequence to 28k length, 65kHz D/A
- The MLS sequence (output of your front end, feeding the headphone amp) is generated by a DSP as opposed to traditional analog signals so you must assign it a D/A sample rate and it must match that of the signal analyzer (you're using 65kHz)
-
Wow, I've seen a few data acquisition front ends in my life, but this one is a winner in the confusion department!! Looks like the person behind the GUI was not a transpose from Apple's human interface team, lol
. Maybe it's because it a full featured analyzer which caters to all kinds of crowds, but still allowing the user to input different sample rates in various parts of the GUI, while at the same time specifying in the user guide that one should not do that is pretty crazy! End of rant, going back to trying to decipher this but I am a feeling this is beyond my limited IQ...
-
So I did another test with the longer MLS word (128K) and the next highest sampling rate:
...
THis shit is pretty complicated, so I figure you might need to look at the manual . Chapter 13 is about MLS and the impulse response etc. Alrighty, I'm listening for what to do next.
I just started looking at the manual but clearly, some things are fishy just from the graph you posted:
- The standard measurement specifies a 160 micro sec. delay (for subtracting from the phase response) and you see in the impulse response that the signal ramps up at around that time
- Yet your 2nd graph at higher sample rate with 128k sequence shows an impulse response starting at 750micro seconds or so.
- Yet again, the resulting impulse responses in the spreadsheets your sent are virtually identical and effectively ramp up at 160 micro seconds
-
Hm. So it looks like the current spreadsheets have reasonably good data, or at least data thats as good as I can get it. I could take data over a longer period of time if that would help by setting the sweep to say 5 or 10 mSec, but there's not much going on out there signalwize. Would that be helpful to look at?
Hi Tyll, have a nice ride
. In regards to the " there's not much going on out there signalize", there's more than meets the eye I'm afraid, especially if you're referring to the lin scale impulse response. We want to see at least 30dB worth of decay and Purrin's data has shown that many headphones take more than 4ms to decay by that amount. I am not sure yet why I don't see it with your data but I suspect one of these menus forces the data to zero toward the end of the time window (exponential decay), even though it doesn't say so.Nice result. Looks like there's some correlation. Let me know if you need any raw impulse response files of other headphones from me for comparison / tweaking Tyll's settings.
Surely, could do with more comparisons, please send me if you have!
 .
. )))
)))
Electrostatic Headphone Measurements
in Headphones
Posted · Edited by arnaud
I agree that there is no such thing as a perfect impulse response as it equals a headphone with unlimited bandwith. In the present case, the microphones may be rolling-off before the headphone and remember that all the measurement chain is lumped on the result...
As for using too much damping, it's probably a bit difficult to answer when it is or not appropriate. I guess we all agree that sharp peaks in the magnitude response (and subsequent long ridges in the CSD plot) are not too desirable. On the other hand, maybe extreme damping on the surfaces of the earcup might actually sound unnatural, like giving too much of a feeling of a direct sound coming from the transducer (I hate to have the sensation that the driver is very near my ears, which does occur with some headphones). Another typical trick is actually using the resonances to enhances the tone (e.g. John Grado's headphones which certainly have a fanbase).
The graphs Tyll shows - at least the FRFs - include results that are both averaged (across 5 or so headphone positions, averaging is done in dB directly so it smooths things out heavily) as well as compensated for the dummy head response. I am not clear yet at what angle of incidence (it's not diffuse field and referred as "Independent of Direction Equilization Parameters", maybe Tyll can clarify).
As for the erratic behavior at high frequency, this is inherent to the physics in place. In particular, imagine that the acoustic wavelength (=340 / frequency) is ~1.5cm at 20kHz... That means that the sound pressure inside the earcup - if it was undamped - would have 40dB swings when you move the microphone of barely 8mm (half a wavelength at 20kHz). Similarly, just pushing the earpads by say 3mm would have also a huge effect on the results.
To illustrate the point, I have updated the simulation results (I said I would not talk about this in this thread anymore but you're asking for explanation and there's nothing better than an image here with SPL from microphones placed ~1cm apart. In the animation plots, you can see it's fairly homgoneous SPL in the base of the earcup (mics location) at 3.5kHz but starts to go a little more wild in the 6kHz one. I can't do these simulations easily up to 20kHz but you'd essentially get even more complex pressure field.
Original post:
FRF:
Animation 3.5kHz: http://www.youtube.com/watch?v=_cV_0vsZX38
Animation 6kHz: http://www.youtube.com/watch?v=HrcnUQ-DXmQ