DefectiveAudioComponent
High Rollers
-
Joined
-
Last visited
Everything posted by DefectiveAudioComponent
-
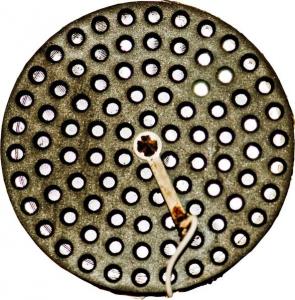
[ATTACH=CONFIG]3523[/ATTACH]
-
That's the one. I've put it on the wikiphonia now.
-
The LCD-2 wood looks good with your furniture. Would it be ok with you to put one of your nice pictures up on the wikiphonia?
-
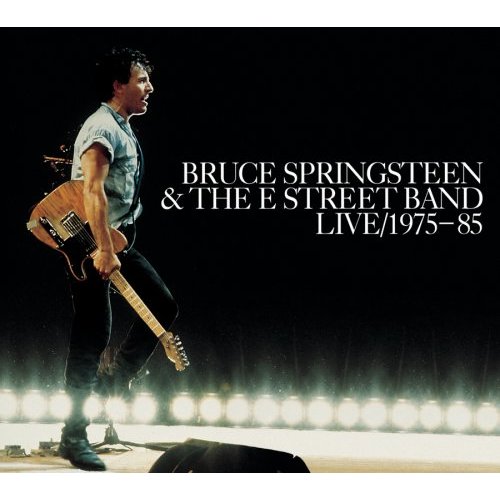
Howard Jones, at an outdoor concert. It all sounded way better than I had expected.
-
[ATTACH=CONFIG]3494[/ATTACH]

-
You need over 15W to blow the drivers with an output of 133db. (but that's the specification... I havent actually tried it...)
-
[ATTACH=CONFIG]3491[/ATTACH]
-
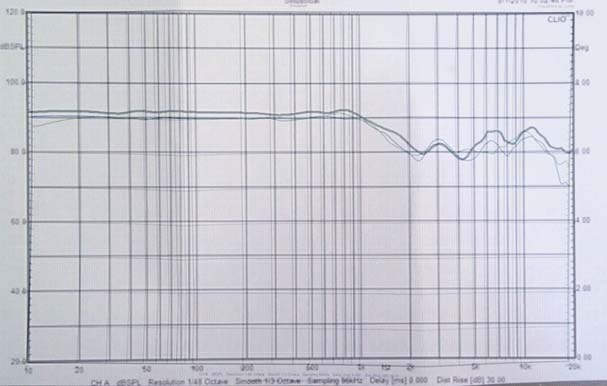
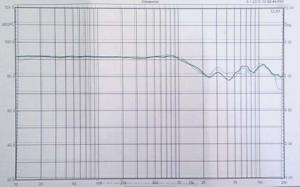
Here I have aligned the background grid instead of the measurement lines. But then it's harder to compare the graphs, because the thick line (the line for the newer LCD-2) is a bit higher up on the graph than my two lines. Overlaid like this it just looks like the newer LCD-2 measures a tiny bit louder overall.... [ATTACH=CONFIG]3476[/ATTACH]

-
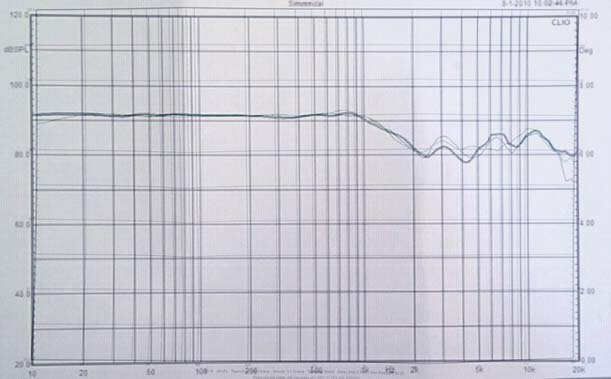
Just for fun, I've taken the latest graph posted from that long thread over there (the thick line) and put my graph on top (the two thin lines). Are they that different really? (The graphs aren't perfectly alingned, instead of aligning the background grid, I tried to align the measurement lines.) (I hope they use the same scale... don't have my printed graph around to double check...) [ATTACH=CONFIG]3475[/ATTACH]
-
A bucket of blue berries from the nearby forest. I took some red ones too.
-
King Uszniewicz and his drunk orchestra - Satisfaction (cover)
-
I prefer different kinds of spiced vodka (could be made from potatoes) with the crayfish. That goes so well with what one sucks and rips out of them. A beer is needed too.
-
I had a huge plate of crayfish.
-
Its always nice to have a chat with NoNoNoNoNoNo.
-
[ATTACH=CONFIG]3455[/ATTACH]
-
I clearly remember bying an expensive bottle of cheap wine at the outdoor concert. I think that was the last thing I bought.
-
[ATTACH=CONFIG]3432[/ATTACH]

-
I've filtered some through a 10-year-old t-shirt.
-
Got cork in my Laphroaig Now I have to pour it all out. Or something.
-
The "upgrade" was an amazing deal.
-
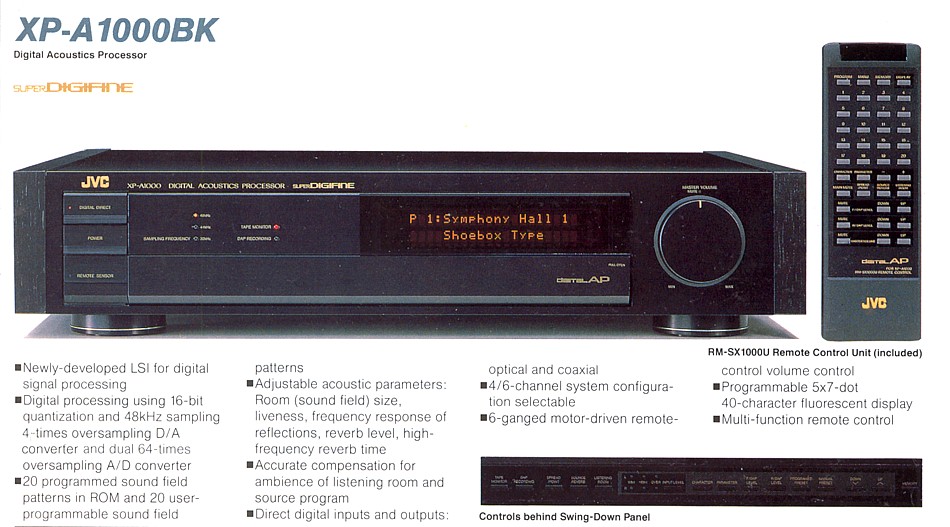
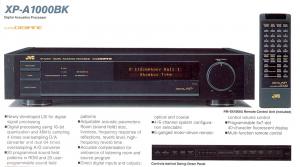
The ambiophonics syntesizer effect from the JVC DAC is not supposed to work through headphones. But I maybe it could work through open-back headphones for the stereo source combined with speakers to play the hall ambience. If that works, it could be a convenient way of improving headstage.
-
The cheapest DAC I could find at the local junk store was an old and heavy JVC Ambience Synthesizer from '89. Too bad the ambience can't be played through a normal 2ch headphone.
-
[ATTACH=CONFIG]3408[/ATTACH]
-
[ATTACH=CONFIG]3303[/ATTACH] Junkie XL - Saturday Teenage Kick
-
That repeat only places this forum on page five of googling his name and studio. So we share only a fraction of his fame now.